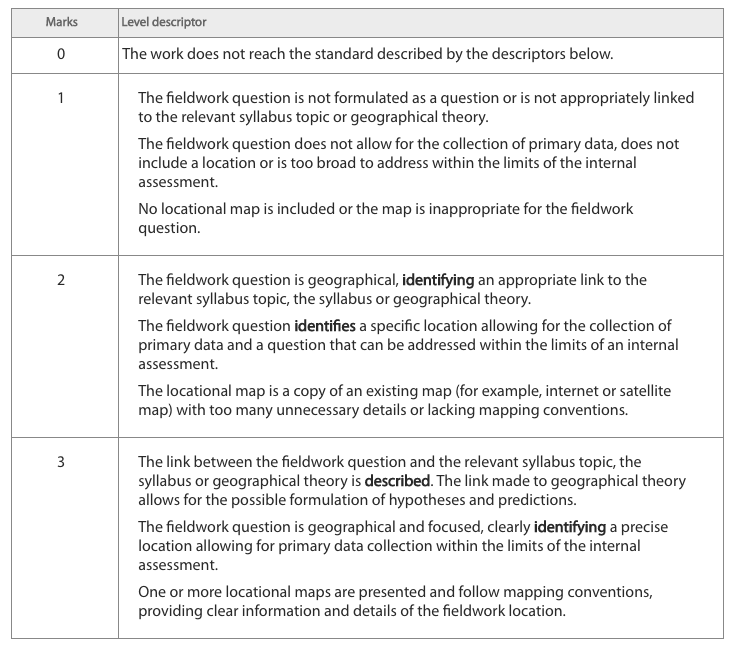
Check your work against the checklist
FIELDWORK QUESTION
Explain why the fieldwork investigation was carried out.
Make a brief, preliminary judgement (prediction) answering the fieldwork question, linked to geographical theory.
State the area of the syllabus to which your Internal Assessment is related.
GEOGRAPHICAL CONTEXT
Describe where the fieldwork investigation was carried out.
Include a map(s) with added value.
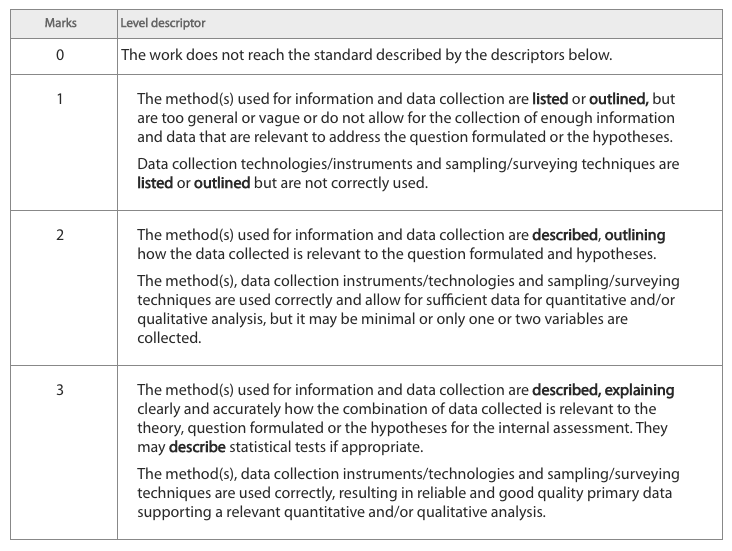
METHODOLOGY
Keep the description concise.
The suggested word count for this section is 300 words.
Evaluate each of the methods used to collect your data.
Describe the sampling size you chose and explain why you chose it.
DATA PRESENTATION
Use the most appropriate methods - simple bar graphs and pie charts using Excel may not be the most appropriate method.
Include a statistical test.
Check that all graphs have their axes labelled, include a title and are integrated in your work.
DATA ANALYSIS
Explain what the patterns in your data mean with reference to your hypotheses and the research question.
Ensure your writing style is clear.
Link your discussion to the fieldwork question.
Identify and explain any anomalies.
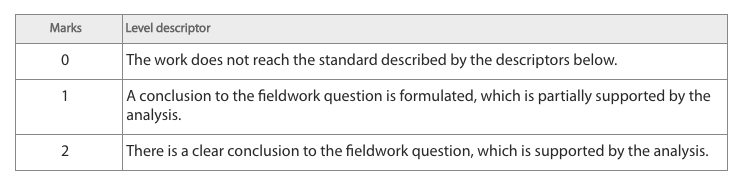
CONCLUSION
Ensure that your conclusion to the fieldwork question is consistent with the outcomes of your analysis.
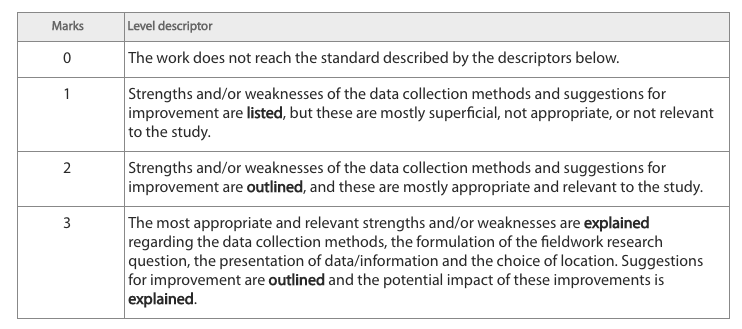
EVALUATION
You have evaluated the data collection methods - this could be done in the methodology section of your Internal Assessment.
Ensure that any recommendations for improvements you make are realistic.
You have made suggestions for modifying the fieldwork question.
OTHER REQUIREMENTS
Broken down your word count and stated it at the end of each section.
You have numbered all pages and there is a contents page.
You have a front cover which includes the IA question, your IB number and the total word count.
Any appendices (only if absolutely needed) should only include examples of materials that have been used or are representative of material used.
All the main text is included in the word count, including the research question, analysis, conclusion and evaluation; as well as all annotations over 10 words and any footnotes over 15 words.
All illustrative material should be numbered and fully integrated into the body of the report.
References used for background information should follow the standard MLA system conventions. This includes information from the internet, where references should include titles,URL addresses and dates when sites were visited. All sources of secondary information must be referenced.
Footnotes may be used to reference material or an alphabetically organised bibliography at the end of your Internal Assessment.
Overall presentation should be neat and well structured.
The following are not included in the word count.
- Title page
- Acknowledgments
- Contents page
- Titles and subtitles
- References
- Footnotes- up to a maximum of 15 words each
- Map legends and/or keys
- Labels- of 10 words or less
- Tables of statistical or numerical data, or categories, classes or group names
- Calculations
- Appendices - containing only raw data and/or calculations
Explain why the fieldwork investigation was carried out.
Make a brief, preliminary judgement (prediction) answering the fieldwork question, linked to geographical theory.
State the area of the syllabus to which your Internal Assessment is related.
GEOGRAPHICAL CONTEXT
Describe where the fieldwork investigation was carried out.
Include a map(s) with added value.
METHODOLOGY
Keep the description concise.
The suggested word count for this section is 300 words.
Evaluate each of the methods used to collect your data.
Describe the sampling size you chose and explain why you chose it.
DATA PRESENTATION
Use the most appropriate methods - simple bar graphs and pie charts using Excel may not be the most appropriate method.
Include a statistical test.
Check that all graphs have their axes labelled, include a title and are integrated in your work.
DATA ANALYSIS
Explain what the patterns in your data mean with reference to your hypotheses and the research question.
Ensure your writing style is clear.
Link your discussion to the fieldwork question.
Identify and explain any anomalies.
CONCLUSION
Ensure that your conclusion to the fieldwork question is consistent with the outcomes of your analysis.
EVALUATION
You have evaluated the data collection methods - this could be done in the methodology section of your Internal Assessment.
Ensure that any recommendations for improvements you make are realistic.
You have made suggestions for modifying the fieldwork question.
OTHER REQUIREMENTS
Broken down your word count and stated it at the end of each section.
You have numbered all pages and there is a contents page.
You have a front cover which includes the IA question, your IB number and the total word count.
Any appendices (only if absolutely needed) should only include examples of materials that have been used or are representative of material used.
All the main text is included in the word count, including the research question, analysis, conclusion and evaluation; as well as all annotations over 10 words and any footnotes over 15 words.
All illustrative material should be numbered and fully integrated into the body of the report.
References used for background information should follow the standard MLA system conventions. This includes information from the internet, where references should include titles,URL addresses and dates when sites were visited. All sources of secondary information must be referenced.
Footnotes may be used to reference material or an alphabetically organised bibliography at the end of your Internal Assessment.
Overall presentation should be neat and well structured.
The following are not included in the word count.
- Title page
- Acknowledgments
- Contents page
- Titles and subtitles
- References
- Footnotes- up to a maximum of 15 words each
- Map legends and/or keys
- Labels- of 10 words or less
- Tables of statistical or numerical data, or categories, classes or group names
- Calculations
- Appendices - containing only raw data and/or calculations
Overview
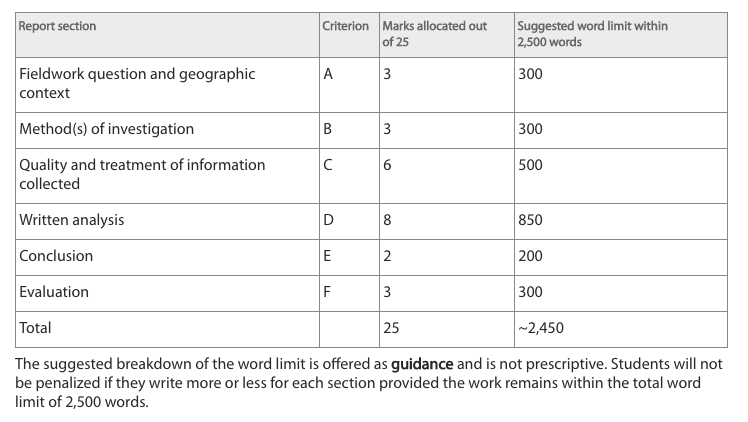
Internal assessment (fieldwork) is an integral part of the Geography course and is compulsory for both SL and HL students. It enables students to demonstrate the application of their skills and knowledge, and to pursue their personal interests, without the time limitations and other constraints that are associated with written examinations.
The internal assessment requirements at SL and at HL are the same. The time allowed is 20 hours. For SL students the IA makes up 25% of the final grade in IB Geography. For HL students it is 20% of the final grade. Students are required to undertake fieldwork collecting primary information and produce one written report of maximum 2500 words that is based on a fieldwork question.
The internal assessment requirements at SL and at HL are the same. The time allowed is 20 hours. For SL students the IA makes up 25% of the final grade in IB Geography. For HL students it is 20% of the final grade. Students are required to undertake fieldwork collecting primary information and produce one written report of maximum 2500 words that is based on a fieldwork question.
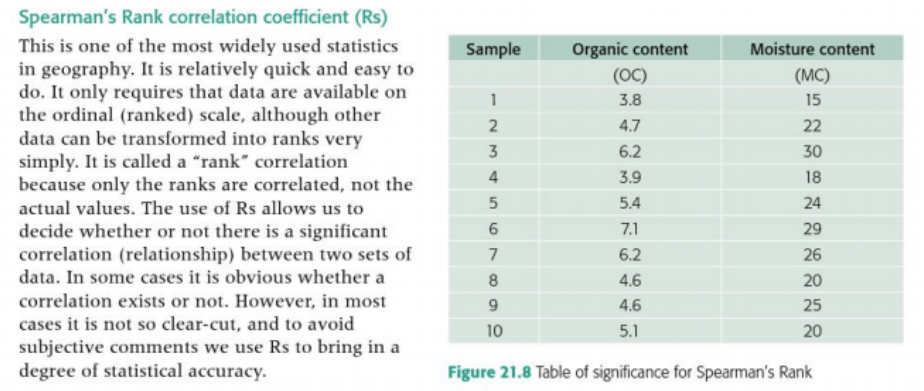
Research question
"Does urban environmental stress in Lausanne, Switzerland decrease as distance away from the CBD increases?"
Link to syllabus
To effectively study this question, we must create a number of related hypothesis that link to the course of study syllabus.
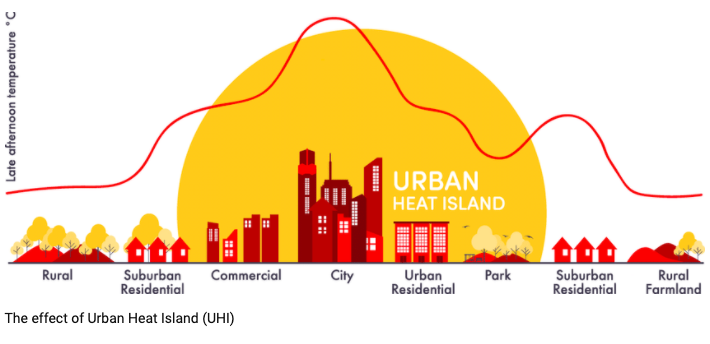
The most direct links can be found in the "urban heat island" effect and air pollution patterns.
Other areas of valid study include traffic congestion patterns, noise, litter and anti-social behaviour such as graffiti.
From the syllabus guide:
Option G: Urban environments
Urban environmental and social stresses
Urban microclimate modification and management, including the urban heat island effect, and air pollution patterns and its management
Traffic congestion patterns, trends and impacts
Managing the impacts of urban social deprivation, including the cycle of deprivation and geographic patterns of crime
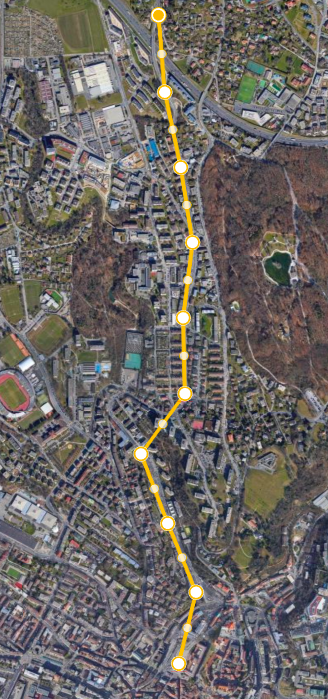
Basemap
The basemap will be important for recording and representing data. Arcgis may well be the most useful. Google maps can also be used.
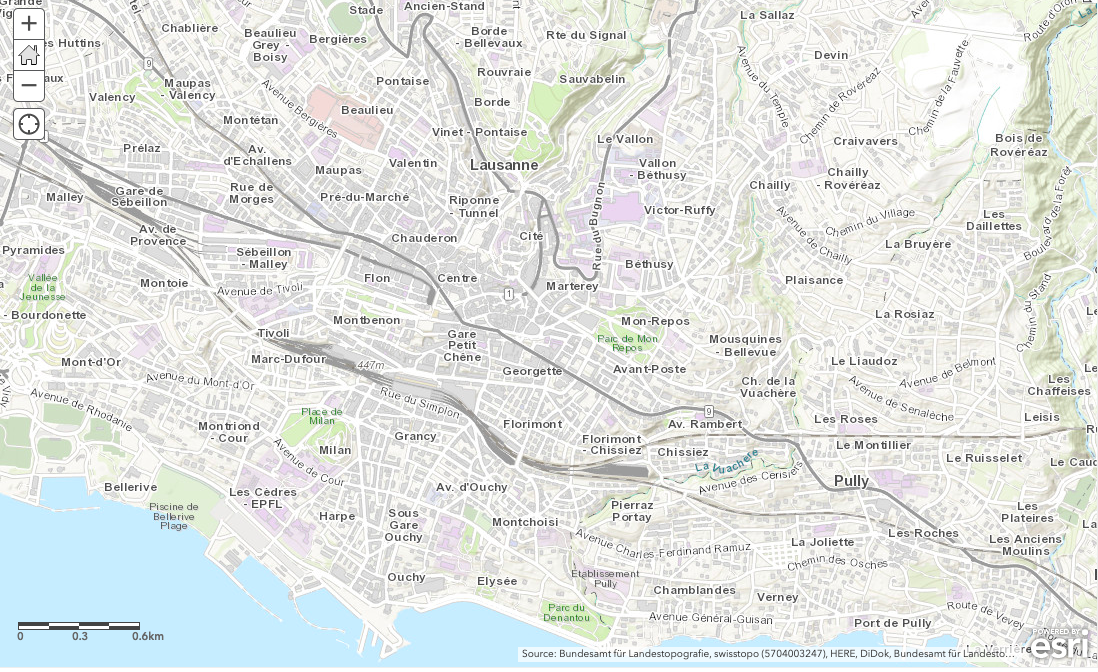
Click on the map for link to Arcgis.
|
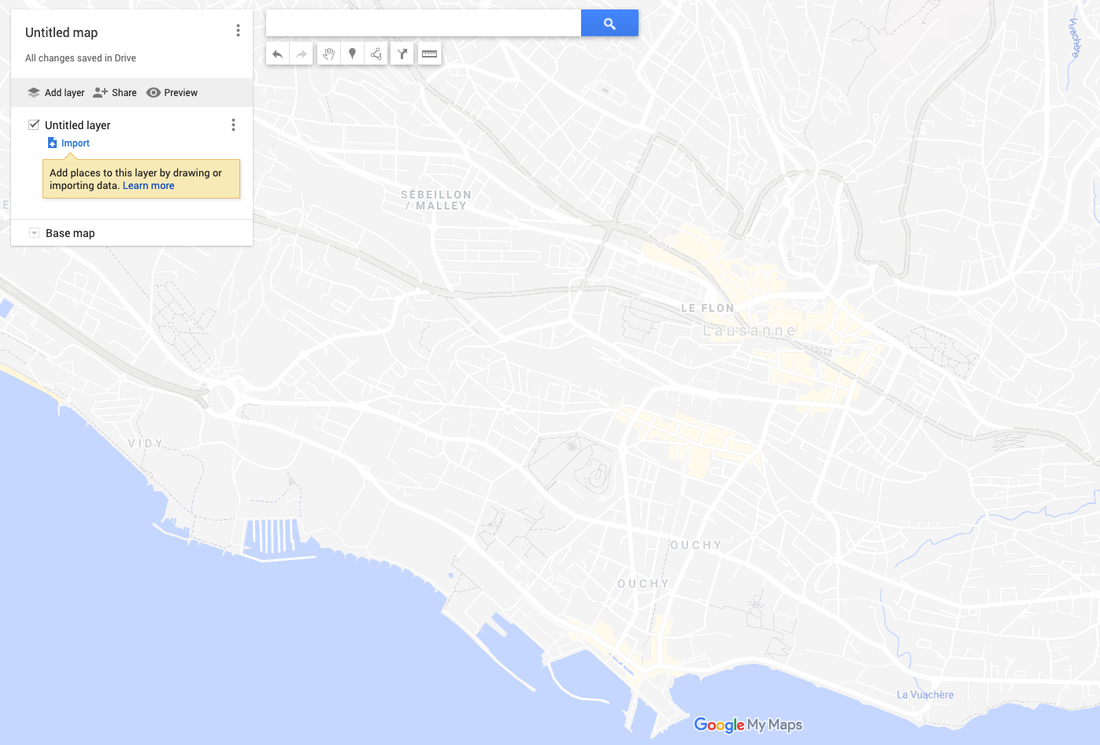
Click on the map for link to Google maps.
|
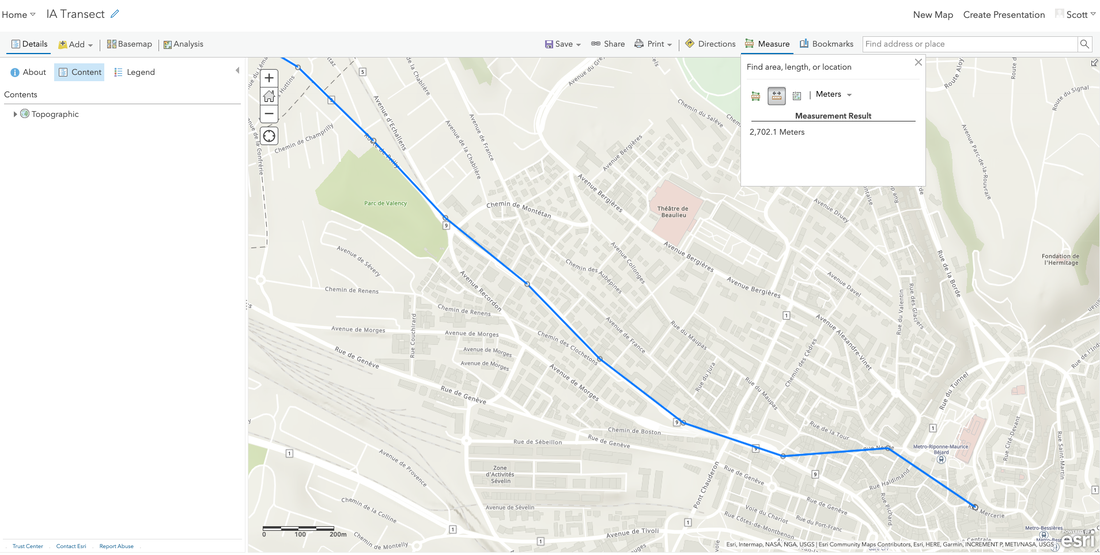
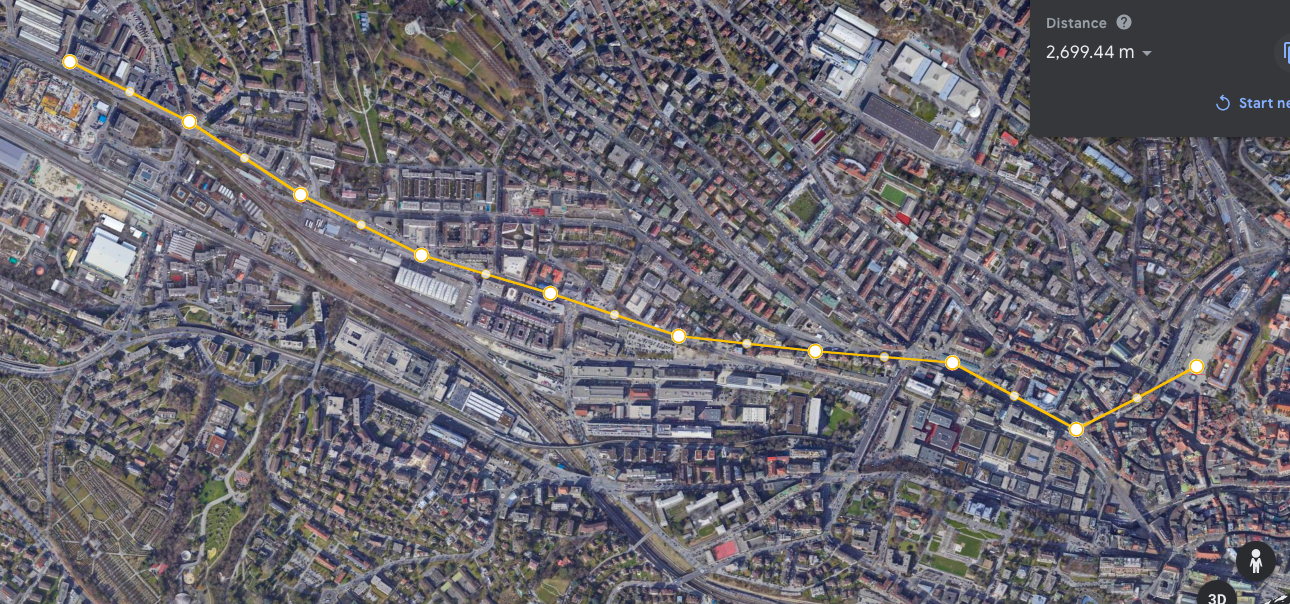
For example, survey points and routes can be plotted using the measuring tool.
Geographical context
It is important to:
Some geographic theories that relate to the question can be studied below:
- Explain why the fieldwork investigation was carried out.
- Make a brief, preliminary judgement (prediction) answering the fieldwork question, linked to geographical theory.
- State the area of the syllabus to which your Internal Assessment is related.
- Describe where the fieldwork investigation was carried out. For example, he height change from the CBD to the lake is some 125 metres. This is enough to change temperature readings.
- Include maps with added value.
Some geographic theories that relate to the question can be studied below:
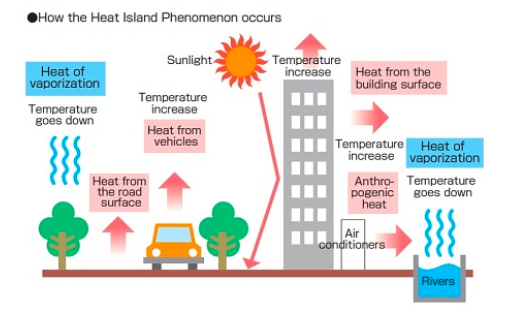
Urban microclimates
The urban heat island is an important geographical theory within this study.
|
|
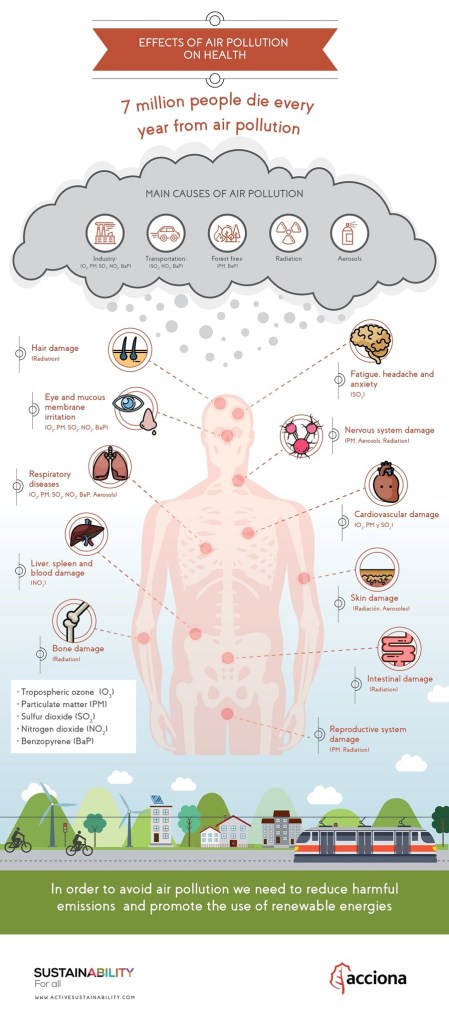
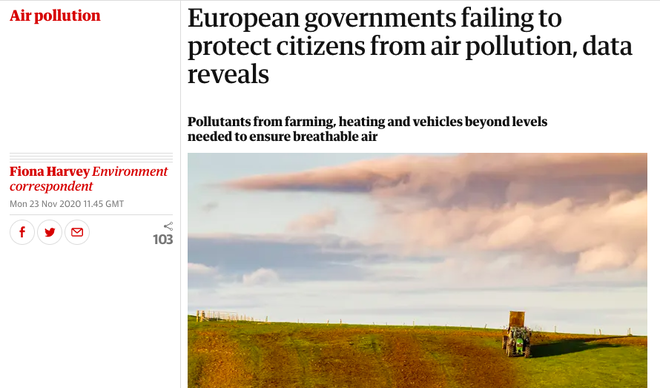
Air pollution
|
Air pollution can be defined as the emission of harmful substances to the atmosphere. This broad definition therefore encapsulates a number of pollutants, including:
Carbon dioxide (CO2) and other greenhouse gases are not typically considered within this category. |
|
Click on image for link
Traffic congestion
Traffic congestion, in simple terms, is the manner in which vehicular movement in impeded by other vehicles due to limited space. This creates gridlock in some cases, resulting in an increase in travel time, high levels of air pollution and other associated urban stress.
Impacts of traffic congestion
- Counter-urbanization – Urban traffic congestion is a major cause of pollution. To escape this problem, the affluent people migrate to out-of-town locations in the rural urban fringe.
- High levels of air, noise and visual pollution – traffic jams leads to emission of high amount of CO2, sulpher dioxide and carbon monoxide, thereby causing air pollution and ultimately leading to global warming
- Traffic congestion is also associated with high blood pressure, heart diseases as well as sleep disorders
- Delays – this causes lateness to work and other functions, hence it reduces the length of time people can work in a day. This could also lead to loss of productivity, as workers report to work late and goods are not delivered to their destination on time
- Increases travel cost – this could be the result of using alternative routes to get to a destination which could be longer, hence increasing the cost of travel. Delays in traffic could increase cost especially when using timed taxis, such as Uber etc or more money is spent on fuel as a result of fuel wastage resulting from traffic congestion.
- Discourages investors from investing in the city
- Wear and tear of vehicles
- Road rage. Drivers may get angry at one another which may result in verbal exchanges or fist fight, leading to death or injuries
Introduction
Make sure that your research question is stated on the front cover and at the beginning of your introduction. Your research question gives your investigation focus. Your hypotheses are related to your research question and give your investigation greater direction.
Your research question again (this time it must be referred to in your introduction)
Relate your research question to geographic theory e.g. Urban heat island, air pollution and traffic density.
Link your research question to the IB specification (Urban environments. Environmental and social stress)
Explain why it is important to carry out research about urban stress.
Introduction to study location. Where, size, brief history, functions.
Your hypothesis. Three hypotheses is best.
Location map or maps (these must have a title, scale and compasss and be referred to in your introduction)
Expected findings. Explain why you expect your hypothesis to be true, refer to theory.
Our hypothesis could be:
"As distance from CBD increases, temperature decreases."
"As distance from CBD increases, background noise decreases."
"As distance from the CBD increases, traffic volume and frequency decreases."
"As distance from the CBD increases, volume and frequency of graffiti and litter decreases."
Link these to the relevant geographical theory and context.
Written introduction example
Methodology
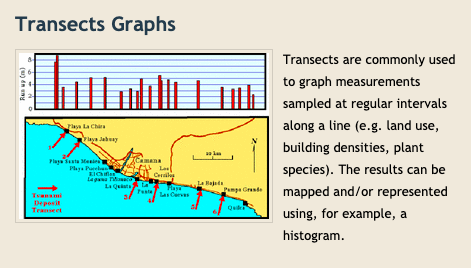
The study lends itself to systematic sampling along defined transects, with the possibility of random sampling if time and safety allows.
We need to decide where the transects will be placed. Two options seem valid:
Using points along the transects, sets of data can be gathered that focus upon urban environmental stress:
Other options such as litter, pedestrian density, vehicle type (SUV's bring greater stress) or graffiti could be considered.
We need to decide where the transects will be placed. Two options seem valid:
- 4 or 5 transects from the CBD outward in the south east corner of Lausanne toward the school, or;
- 2 long transects north/south and east/west across Lausanne and running through the CBD.
Using points along the transects, sets of data can be gathered that focus upon urban environmental stress:
- Temperature
- Air pollution levels
- Noise
- Traffic density
- Litter and graffiti
Other options such as litter, pedestrian density, vehicle type (SUV's bring greater stress) or graffiti could be considered.
For maximum marks, you must explain the value and appropriateness of the methods used and why they help give us valid data.
Introduction to location of data collections and transects. Include maps to show this.
Introduction to the information being collected, what methods are being used name them
Copies of your data collection form, either imbedded or in your appendix
Explanation of why this information is important and how it will help you prove or disprove your hypothesis.
Explanation of how information is collected (methodology). You can include photos that demonstrate data gathering techniques. Explanation of why you chose the particular techniques e.g. tally charts, systematic sampling methods etc.
List the equipment used.
Remember, annotated text boxes up to 10 words long are free from the word count rules. Use them.
|
Equipment:
Thermometer and CO2 reader. Noise meter app on mobile. Remember to show, in diagram form might help, the process; stand at side of road and record for one minute. |

|
Example of written methodology
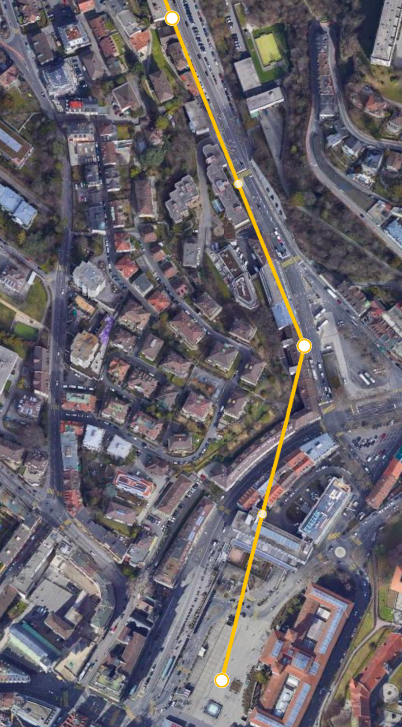
Data collection
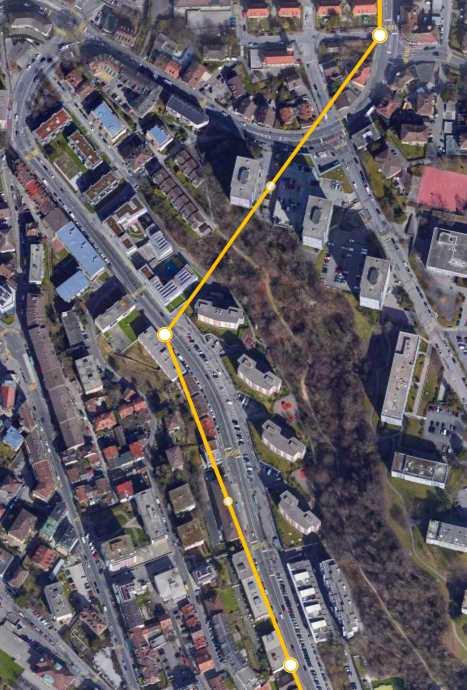
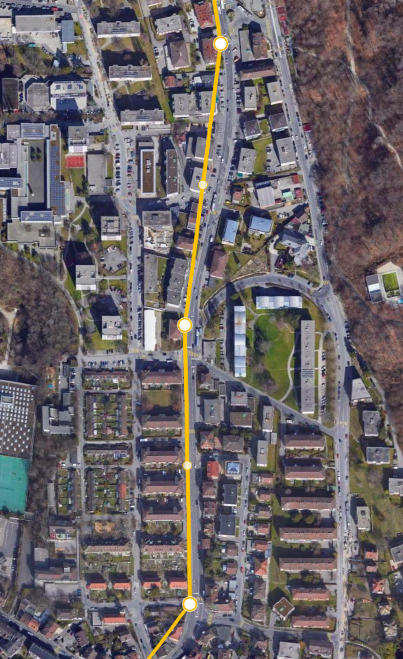
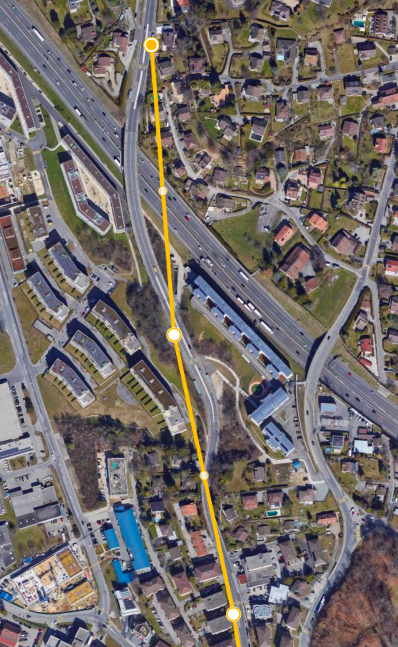
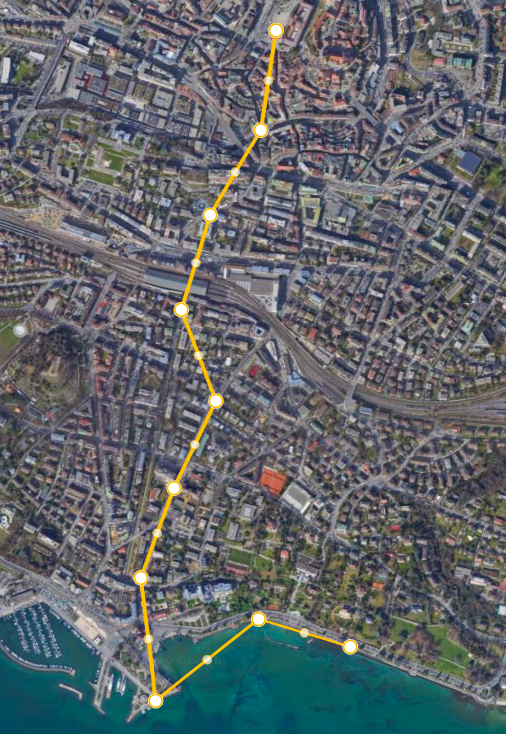
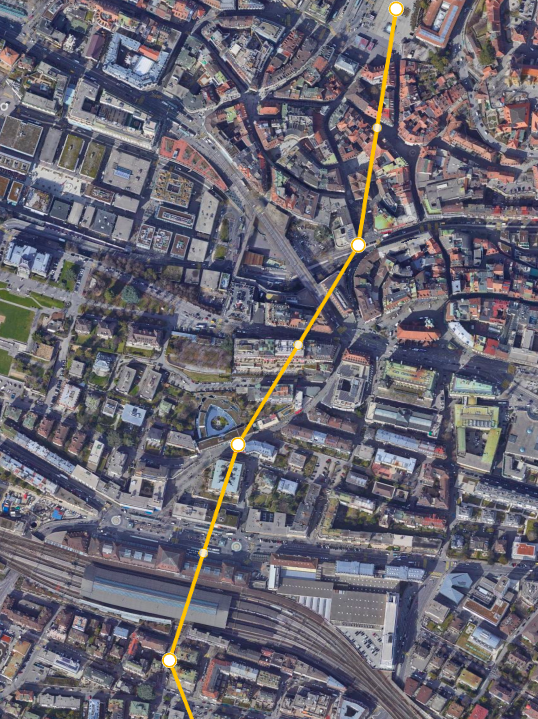
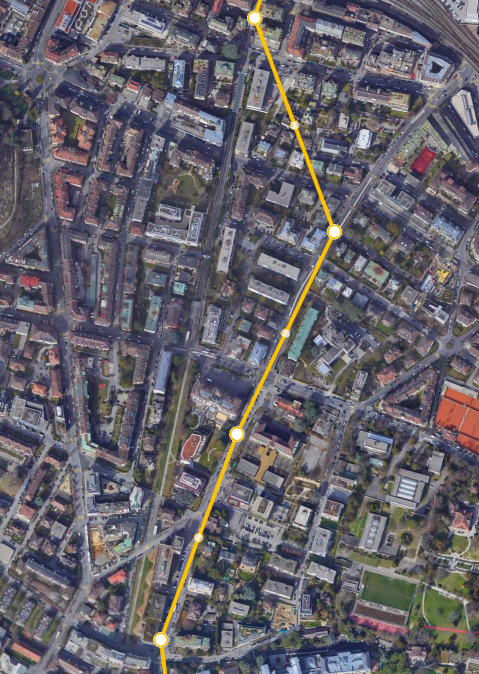
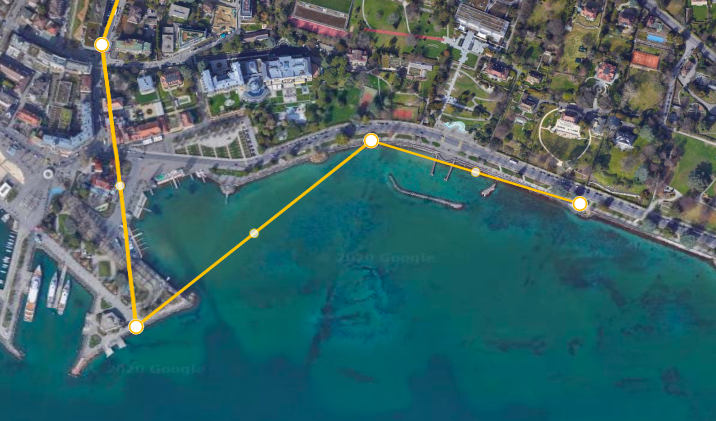
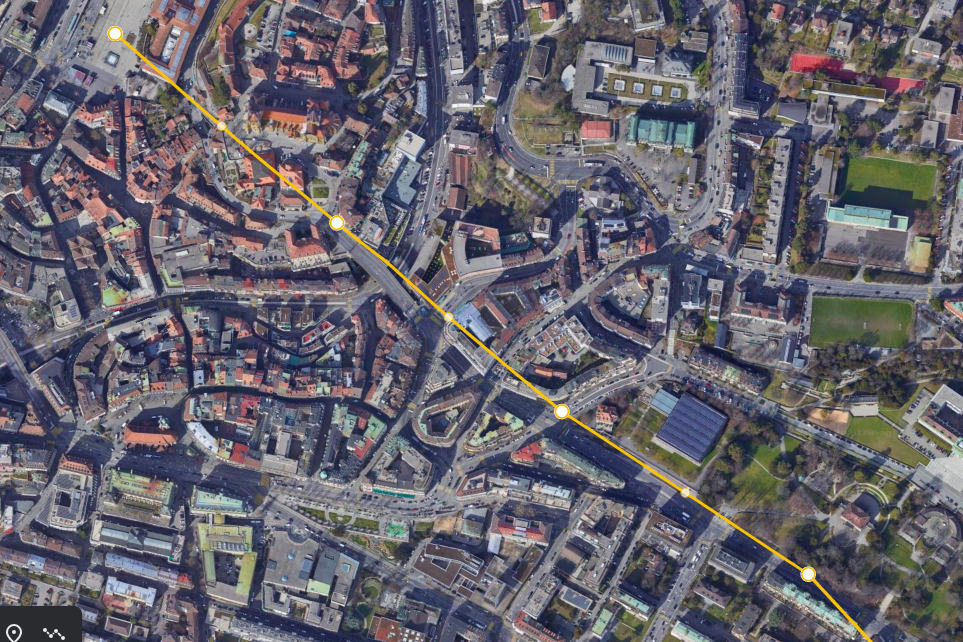
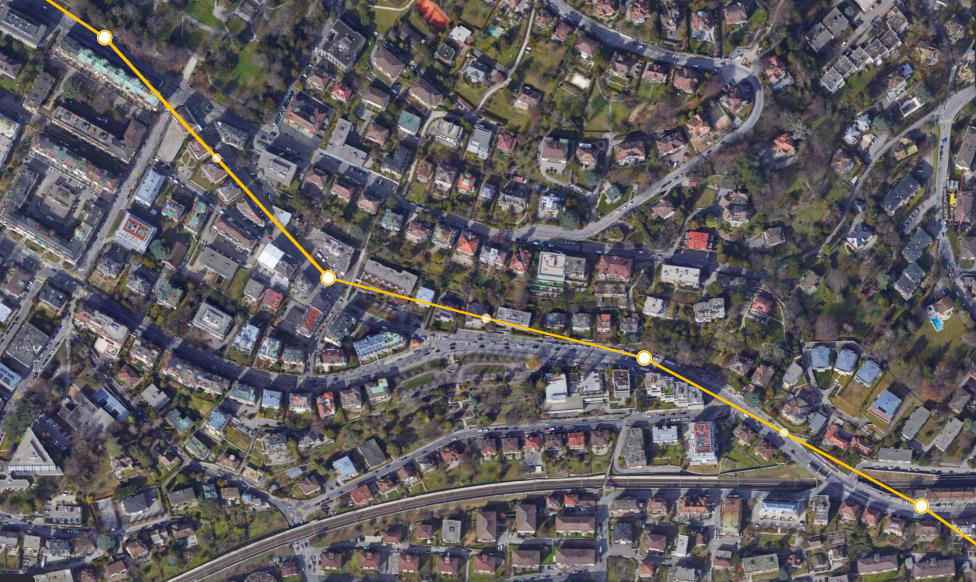
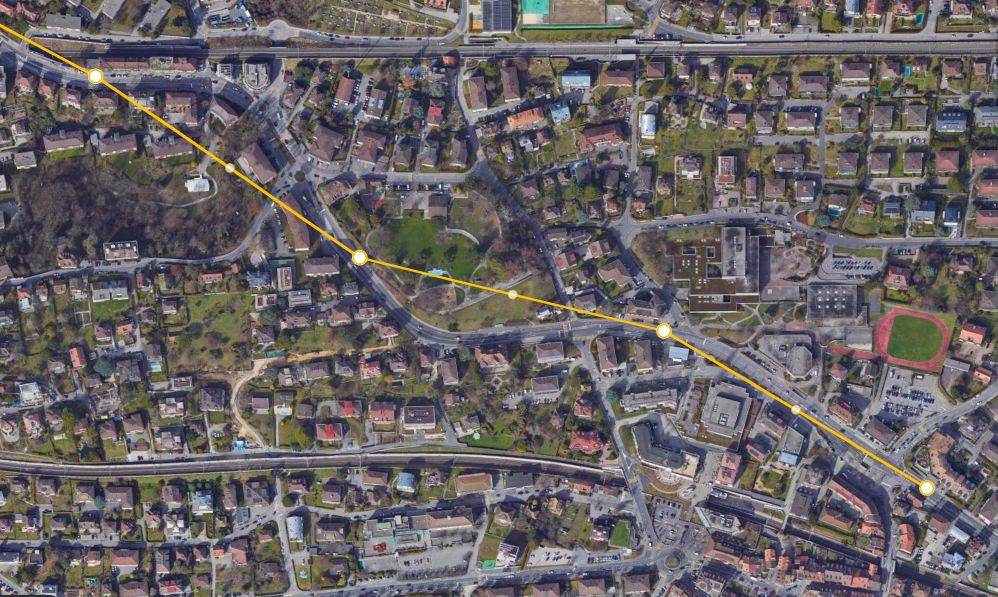
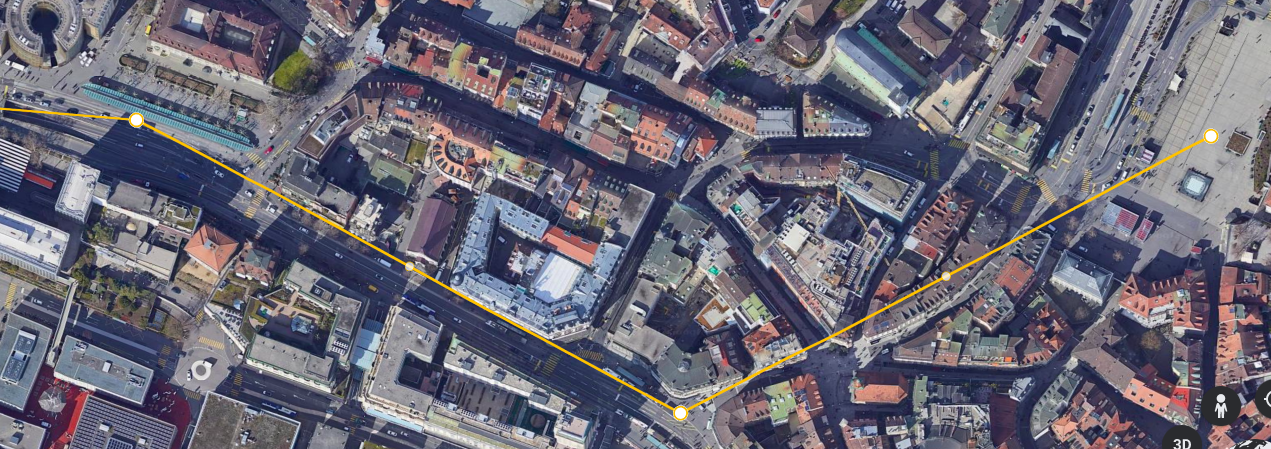
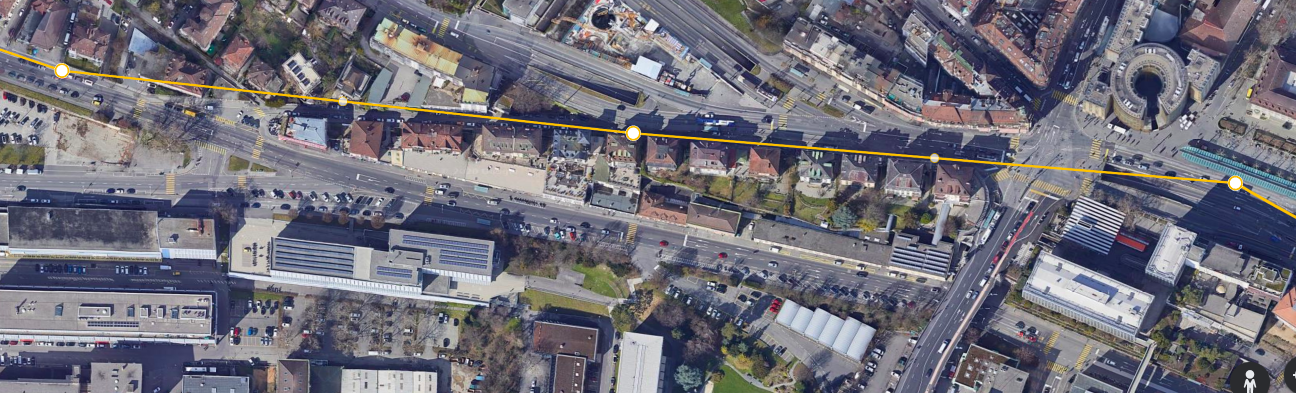
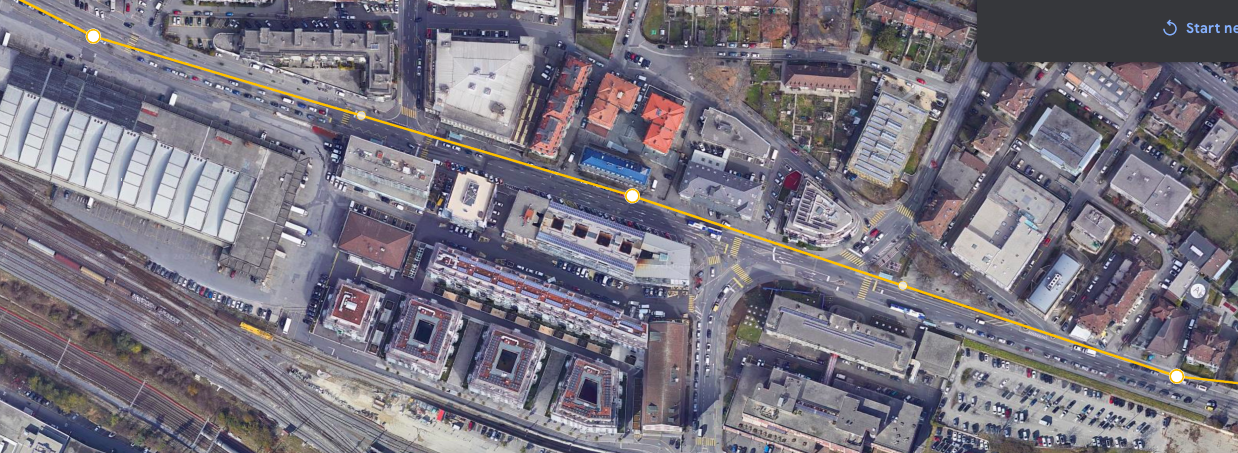
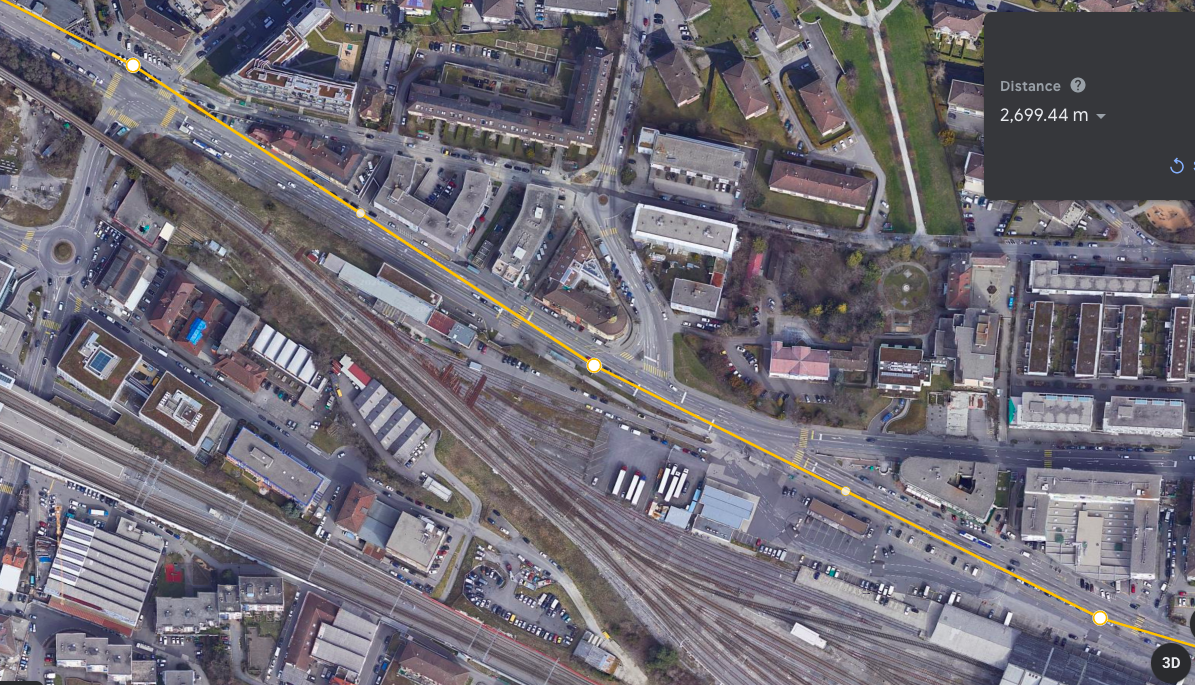
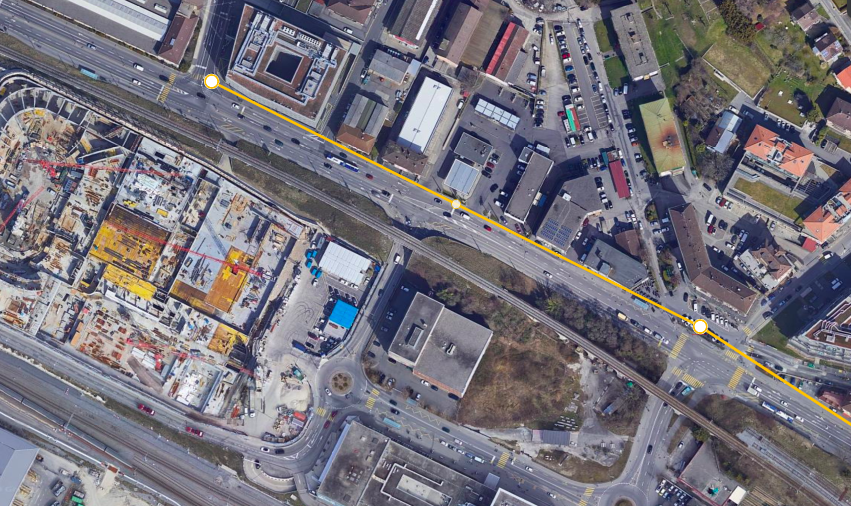
Survey sites using Google Earth. Points every 300 metres.
Four transects moving away from the CBD in directions north, south, east and west.
Four transects moving away from the CBD in directions north, south, east and west.
North
|
|
|
|
|
South
|
|
|
|
East
|
|
|
|
West
|
|
|
|
|
|
Data presentation
Spatial analysis is a key part of the survey and should be used feely in the presentation of data. Patterns, variations and anomalies moving away from the CBD are the focus.
Remember, the data is the data and we are not out to prove the question right or wrong. We are examining the question and theories based upon the data that we have.
Remember, the data is the data and we are not out to prove the question right or wrong. We are examining the question and theories based upon the data that we have.
Examples of presentation technique.
|
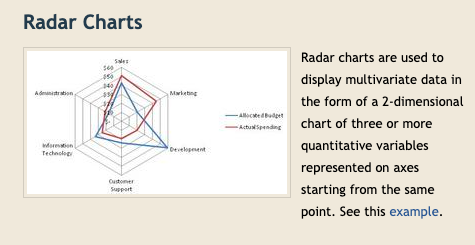
Click image for example link.
|
|
Using the map facility on Survey123 will be a big help, but hand drawn base maps and data presentation on these with annotated analysis will be needed.
Photographs from specific sites can be used freely, and should be. |
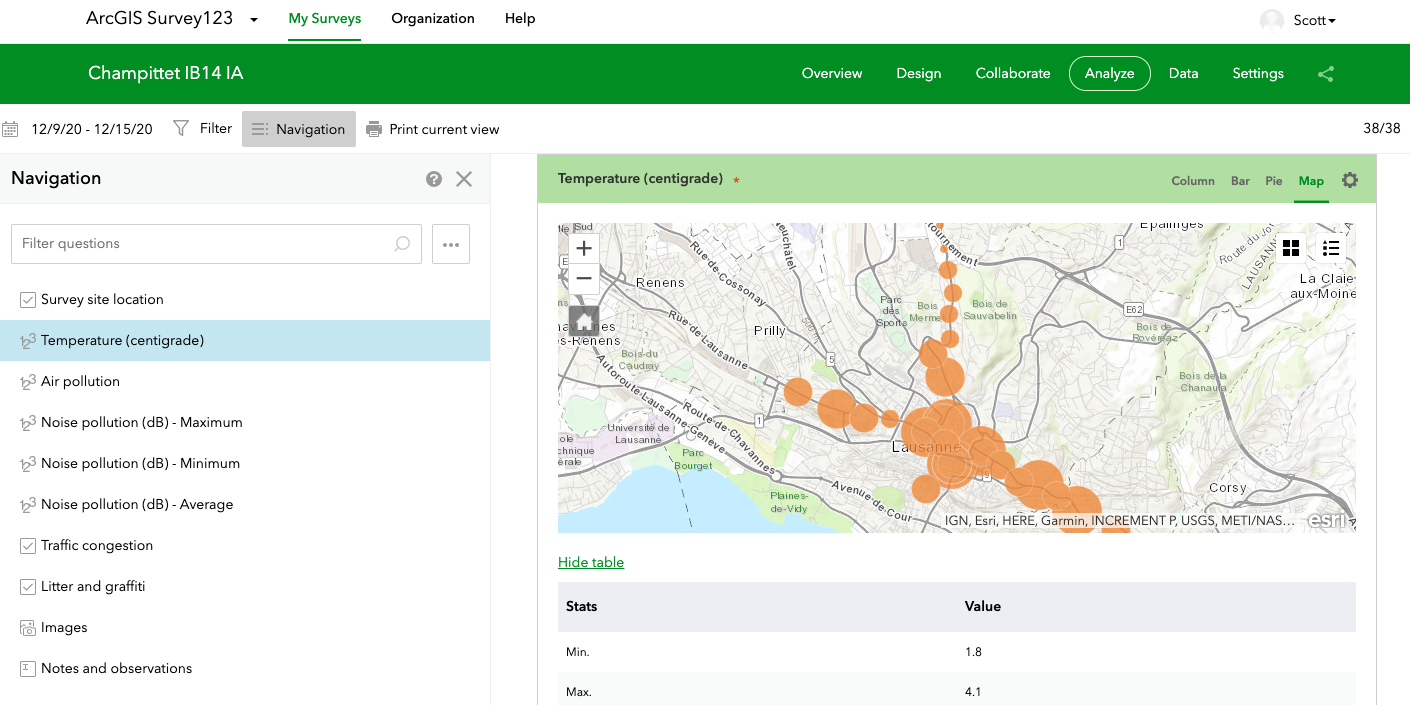
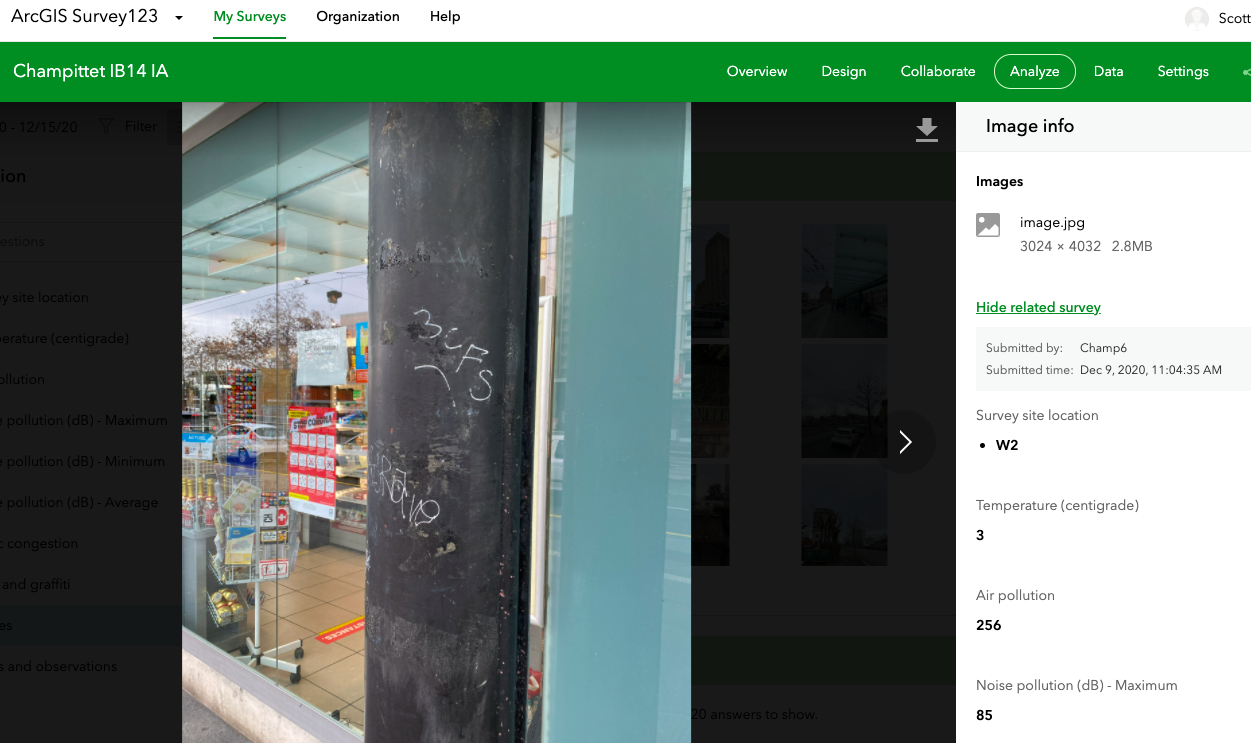
|
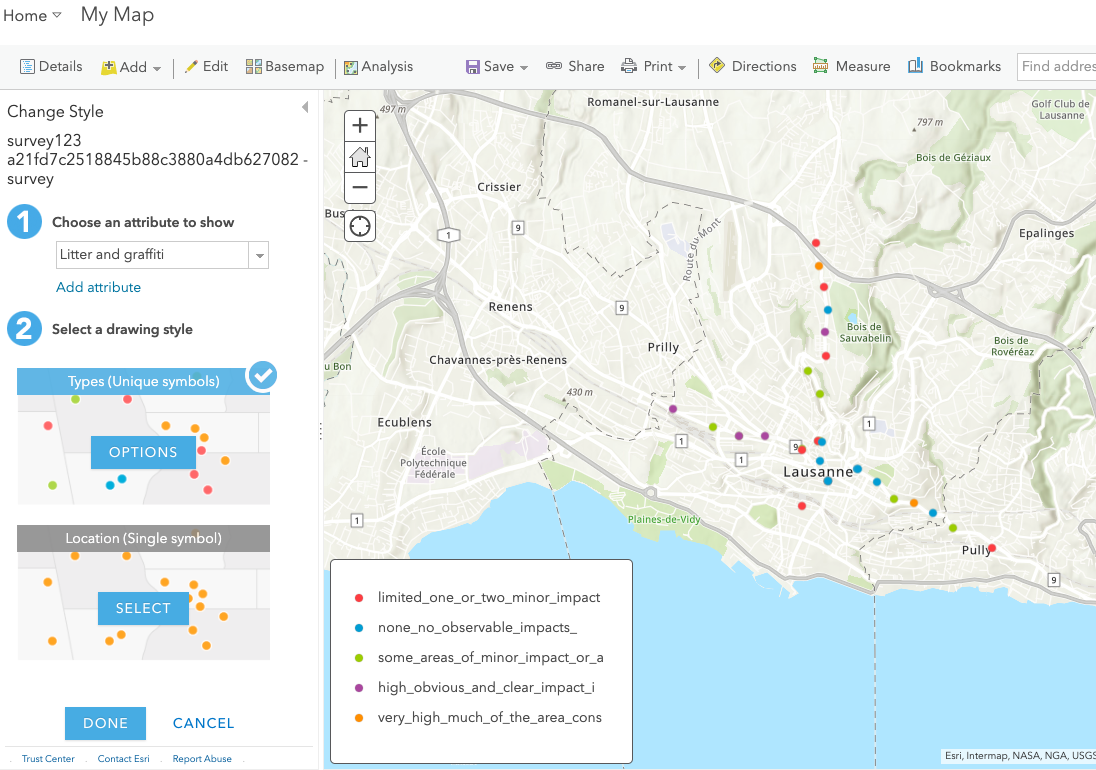
Here is some mapping manipulation on Survey123 that you can try and use. Follow the instructions. Some of this might work well.
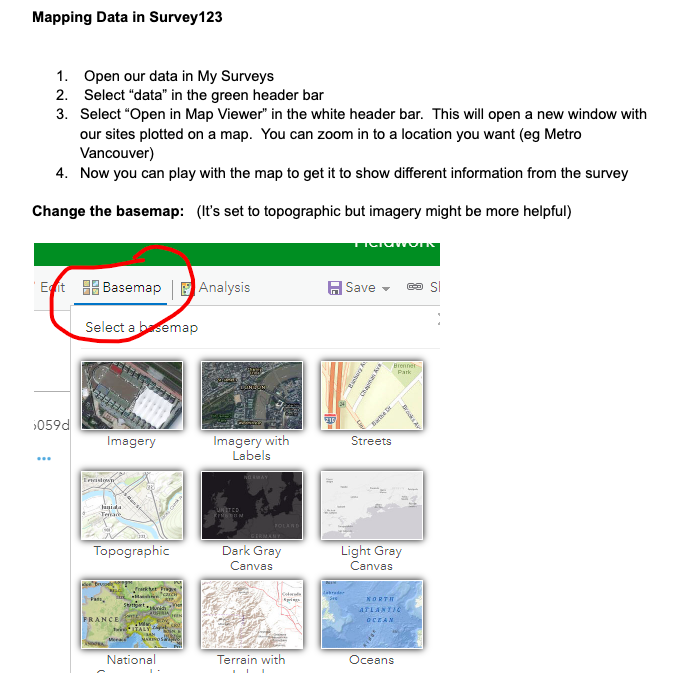
|
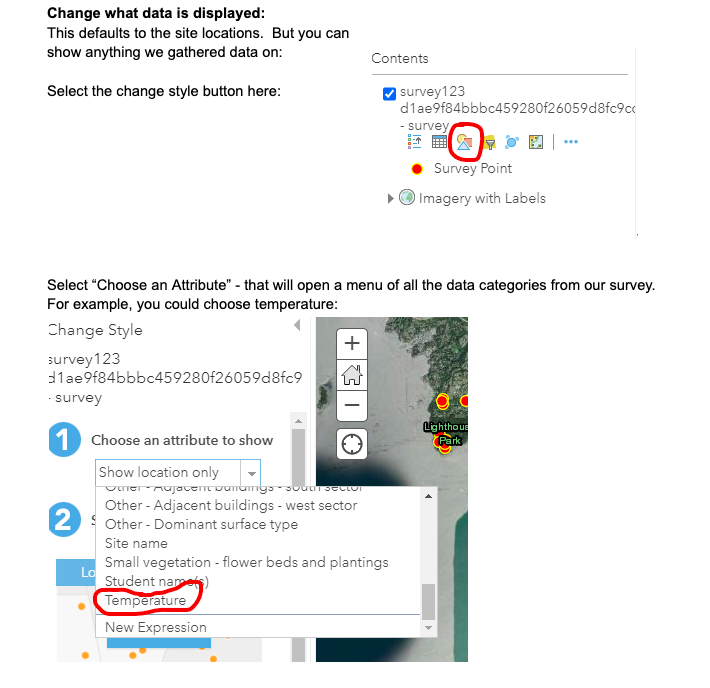
|
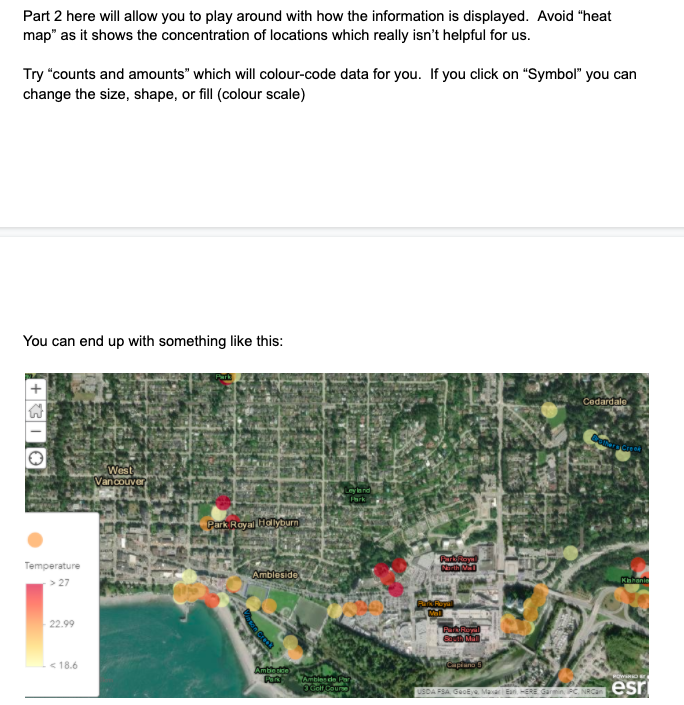
|
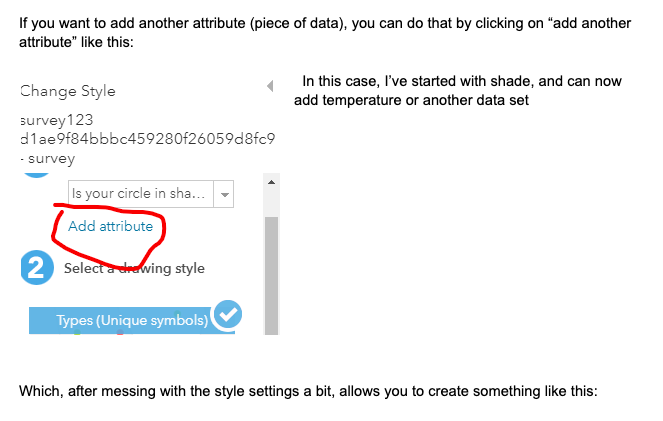
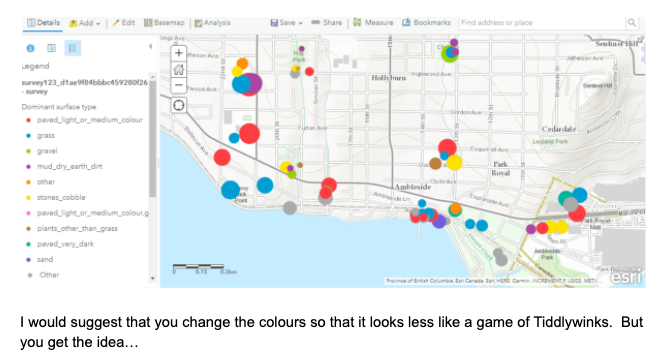
|
This what our litter and graffiti data looks like.
Data analysis
|
Analysis should be framed in terms of the question and hypothesis and related specifically back to these and the relevant geographical theory and context.
|
"Does urban environmental stress in Lausanne, Switzerland decrease as distance away from the CBD increases?"
"As distance from CBD increases, temperature decreases." "As distance from CBD increases, background noise decreases." "As distance from the CBD increases, traffic volume and frequency decreases." "As distance from the CBD increases, volume and frequency of graffiti and litter decreases." |
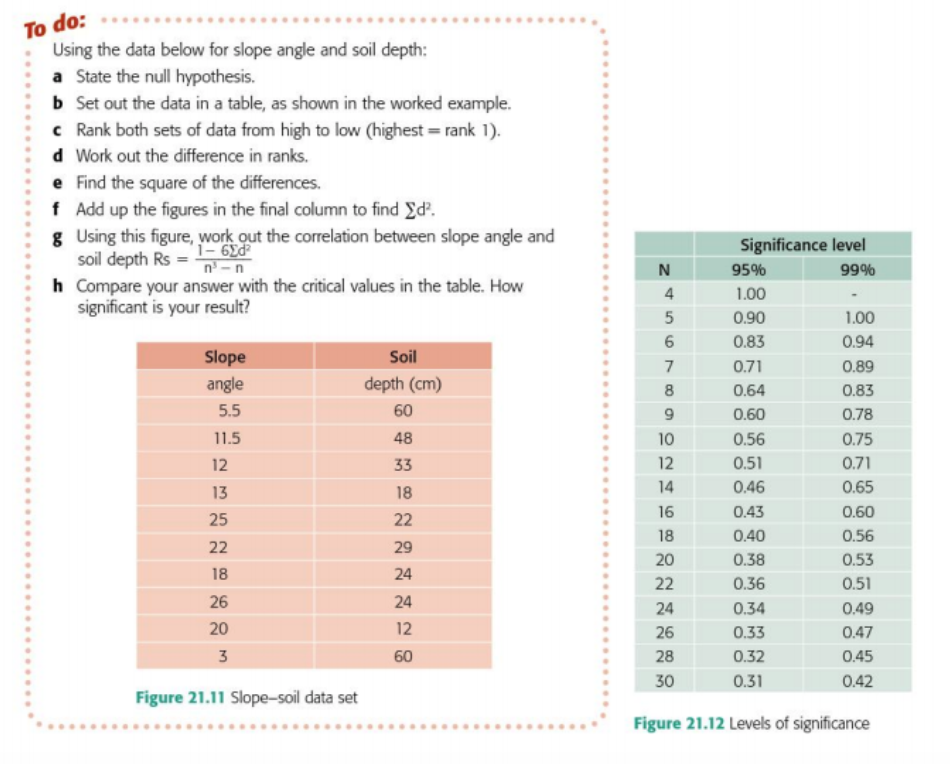
You must have at least one statistical test in your analysis.
|
|

|
|
|
|

|
|
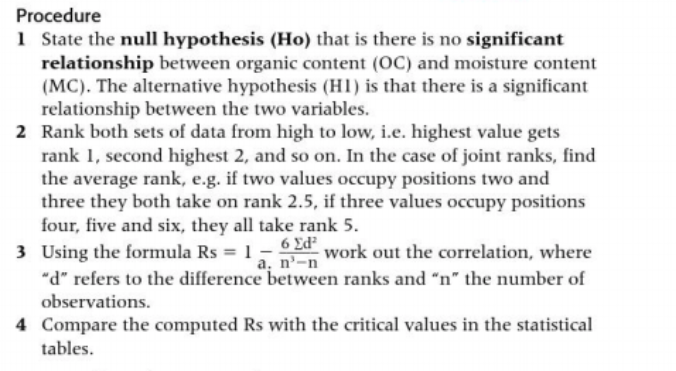
Here are our calculations for temperature using the west and north data.
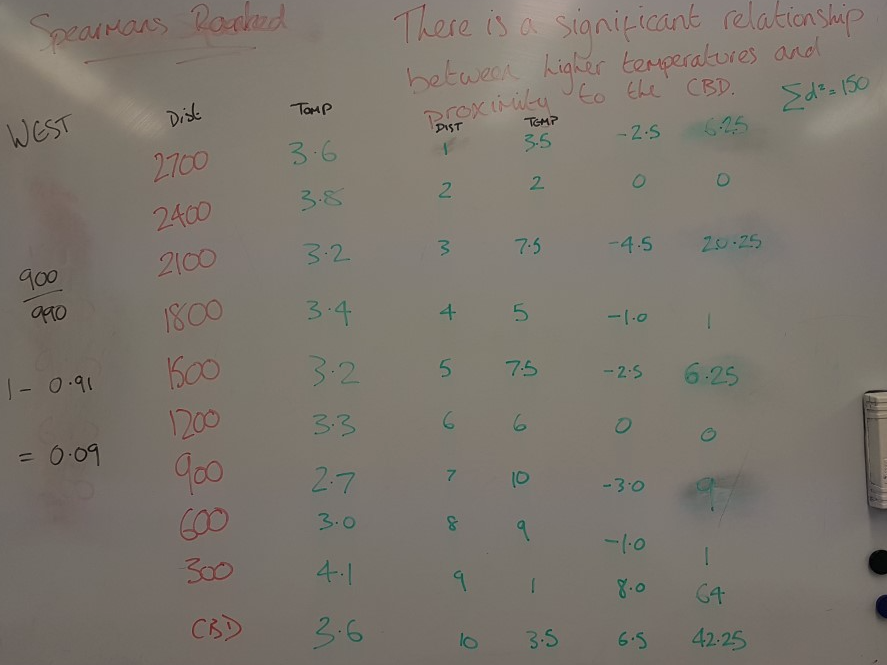
Data from CBD to the west.
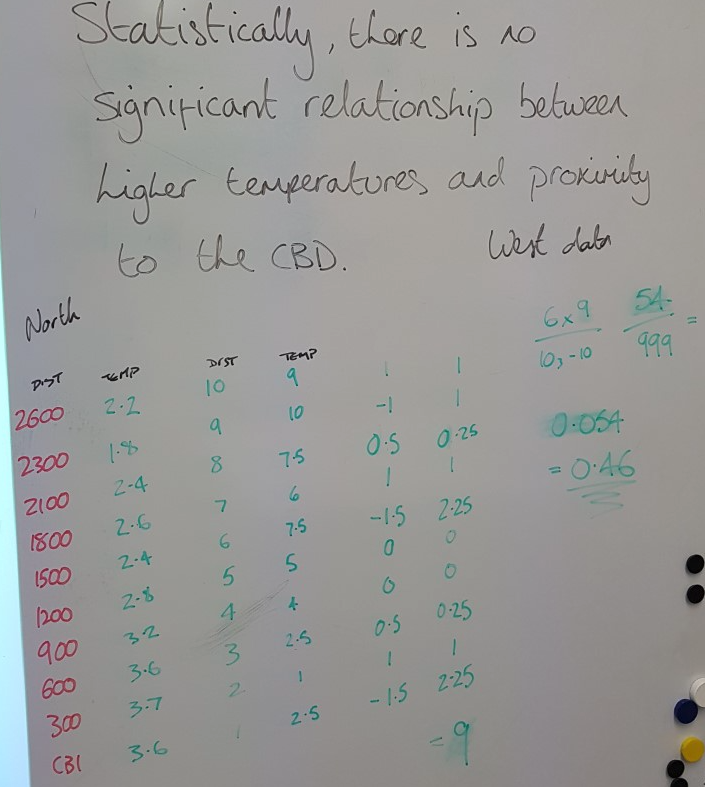
Data from CBD to the north. This time, the rank of distance was flipped so that the CBD was ranked 1. Still no significant relationship.
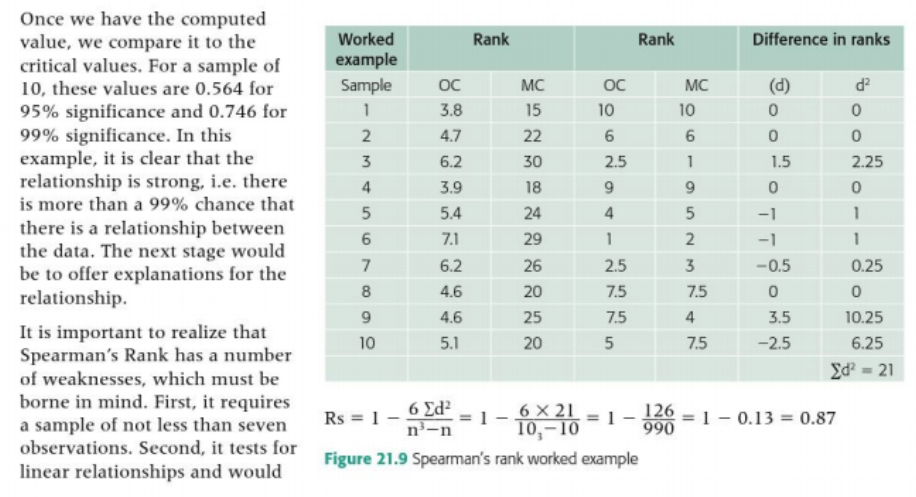
|
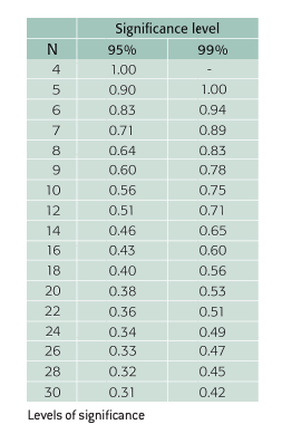
When checked against levels of significance, we can clearly see that both values fall short of the the 99% and 95% levels of significance, although the north value of 0.46 is far closer to 95% than the west value of 0.09. This may be because the highest value for distance was flipped to be the closest to the CBD. This would make sense as the correlation in the positive hypothesis is that higher temperatures are closer to the CBD, meaning that the CBD should be ranked as 1, w1 ranked 2, w2 ranked 3, and so on. This from the RGS seems to back up the point made. We can thus make the hypothesis: the temperature decreases as distance from the CBD increases. Highest values then are closest to the CBD for distance. |
|
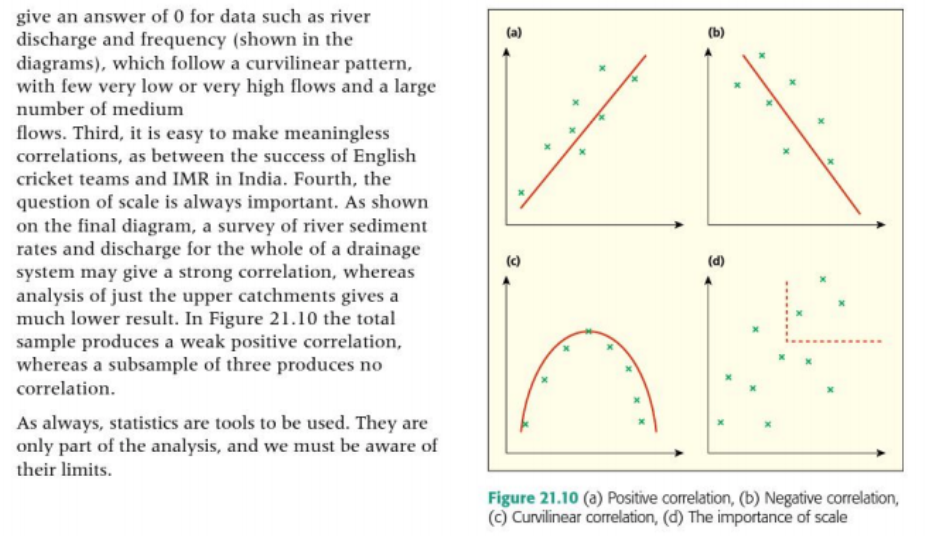
Remember, you can also do this test for CO2 and noise.
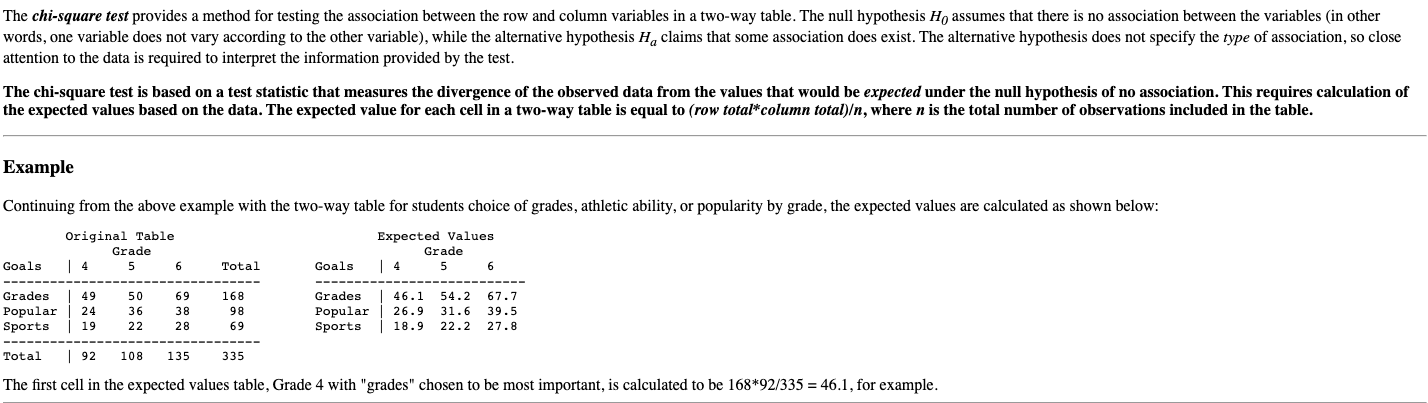
We can also use Chi-Squared to see if there's a significant difference between the survey points as the distance from the CBD increases, the idea being that survey points 1 and 2 (close to CBD), for example, are significantly different to points 8 and 9 (farthest away from CBD).
To do this, we can simply add the total values for each of the 4 survey points (1w, 1n, 1, 1e, 1s) for each of the categories surveyed; temperature, noise, CO2, traffic and graffiti (using values of 1 to 5 on the Likert scale).
To do this, we can simply add the total values for each of the 4 survey points (1w, 1n, 1, 1e, 1s) for each of the categories surveyed; temperature, noise, CO2, traffic and graffiti (using values of 1 to 5 on the Likert scale).
|
|
|
|
|
|
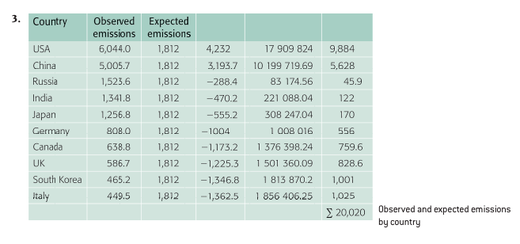
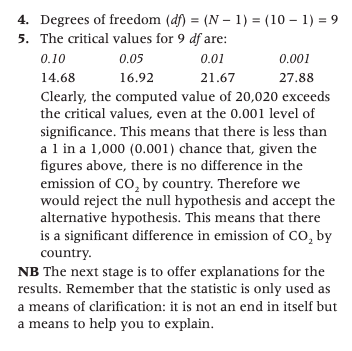
How to find the expected value:
Conclusion
Keep it simple. Are the hypothesis accepted or not? How strongly do you accept the answer to the fieldwork question? Is the data statistically significant enough?
Evaluation
Areas of valid and relevant evaluation include:
- Change of height between data points and effect on temperature
- Weather on the day - front around mid-day
- Likert scale vs physical car count
- Two groups with two sets of equipment - calibration issues
- Distance covered enough to find statistical change in data?
- CO2 reading; NOX or carbon monoxide stronger indicator
