The facts you need to know about the Climate Emergency:
(UN Environment Programme)
- The planet’s average surface temperature has risen by 0.5 degrees since the late 19th century (NASA).
- The total annual global greenhouse gas emissions reached its highest levels in 2017, with no sign of peaking. (EGR, 2018).
- Impacts of a 0.9-degree increase are here today: increased frequency and magnitude of extreme weather events.
- Actions of the global community to date are insufficient, (EGR, 2018)
(UN Environment Programme)
The European Parliament declared a climate emergency on Thursday 28th November 2019, in a largely symbolic move that nonetheless increases pressure on member states to pass more decisive legislation to curb emissions.
In recent months, hundreds of similar declarations have been passed - most of them by regional or local administrations. Thursday's EU vote is significant because it was passed by a parliament that represents more than 500 million citizens, vastly expanding the number of people worldwide who live in jurisdictions that have declared such an emergency.
Europe would become the first continent to reduce emissions to net-zero by 2050, and that targets for cutting greenhouse gas emissions by 2030 must be made "more ambitious".
"If there is one area where the world needs our leadership, it is on protecting our climate," said the EU's president-elect. "This is an existential issue for Europe - and for the world."
However, not all member states are in agreement. Poland, Hungary and the Czech Republic have blocked efforts to reach climate neutrality by 2050, demanding more money to help them transition.
To further complicate matters, some members of the European Parliament and activists are already skeptical about how serious von der Leyen (EU president-elect) is about her plans and - even if she is - whether her mandate gives her enough leeway to pass them.
"The Commission's structural and political constraints are likely to produce a set of watered-down, piecemeal solutions," David Adler and Pawel Wargan of the international activist coalition Green New Deal for Europe suggested. "Meanwhile, the clock on climate and environmental breakdown keeps ticking away."
To meet the goal set by the Paris agreement to stay below a 1.5 degrees Celsius temperature rise, the required cuts in emissions are 7.6 percent per year on average, according to a 2019 report by the UN Environment Program.
Scientists estimate that current targets would lead to up to 3 degrees Celsius of global heating and cause catastrophic changes across the globe, including floods, cyclones, long-lasting heat waves, and record-breaking wildfires, among others.
(LUISA BECK, RICK NOACK & QUENTIN ARIES, THE WASHINGTON POST, 28 NOV 2019)
CONSIDER
How positive do you feel that the changes and strategies needed to meet the Climate Emergency will be achieved?
In pairs or small groups, discuss what you feel can and can't be achieved. Justify your thinking.
Feed back to the class.
How positive do you feel that the changes and strategies needed to meet the Climate Emergency will be achieved?
In pairs or small groups, discuss what you feel can and can't be achieved. Justify your thinking.
Feed back to the class.
TASK
1. What are the main causes of natural climate change?
2. What is the correlation (positive or negative link) between these natural causes and global temperature change? Explain your answer.
3. What is the conclusion to be reached from this video evidence? Use examples in your answer.
1. What are the main causes of natural climate change?
2. What is the correlation (positive or negative link) between these natural causes and global temperature change? Explain your answer.
3. What is the conclusion to be reached from this video evidence? Use examples in your answer.
What is the climate like where you live? Have you ever experienced any unusual weather, such as extreme dry or wet spells?
Weather and climate has always changed and continues to do so. However, current change is occurring at a much faster rate than ever known before.
Since global records began in 1880, we have recorded:
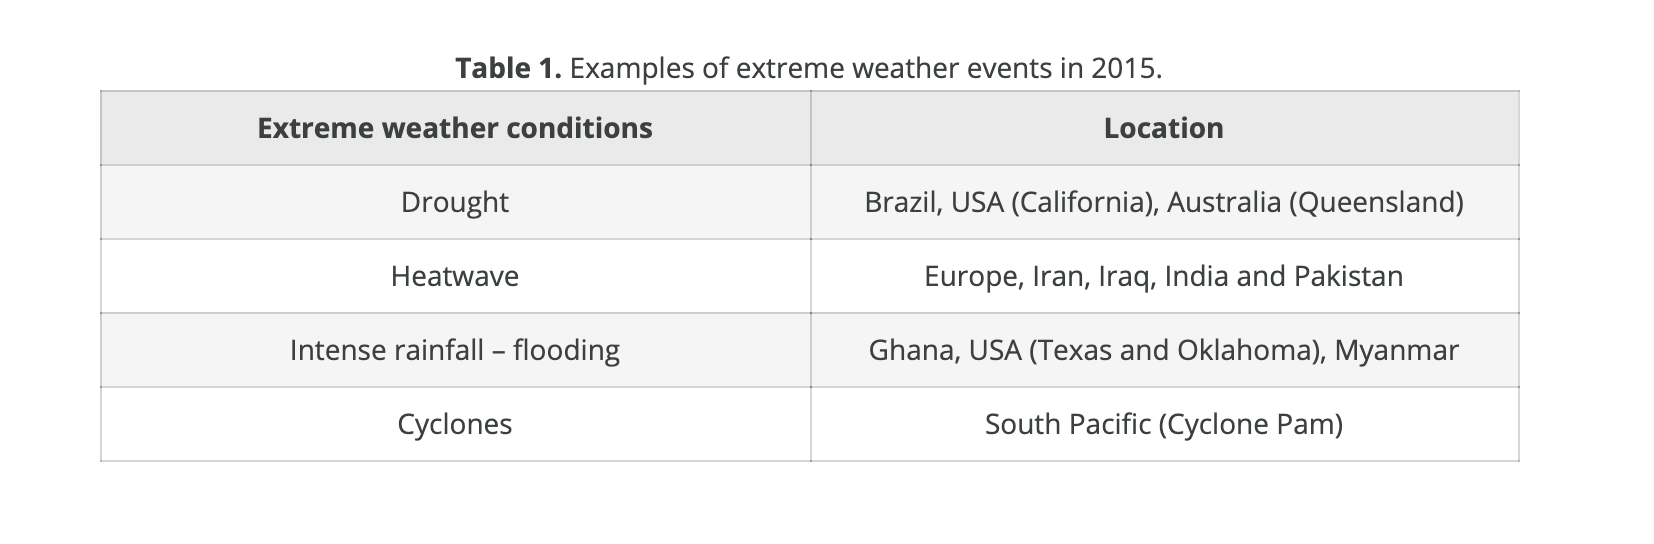
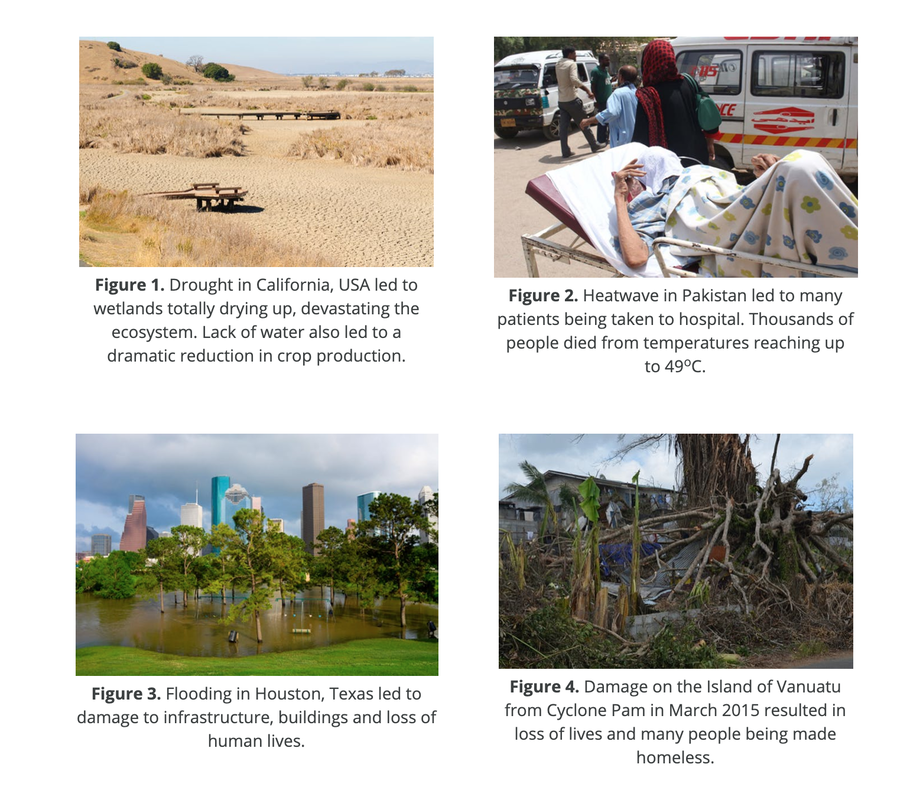
We are also experiencing more frequent extreme weather events.
Weather and climate has always changed and continues to do so. However, current change is occurring at a much faster rate than ever known before.
Since global records began in 1880, we have recorded:
- The warmest year in 2014.
- Warmest month in July 2015.
- The ten warmest years between 1998 and 2014.
We are also experiencing more frequent extreme weather events.
Climate emergency: 2019 was second hottest year on record
Last decade was also hottest yet in 150 years of measurements, say scientists.
‘The drumbeat of the Anthropocene’: alarming heat records revealed. The year 2019 was the second hottest on record for the planet’s surface, according to latest research. The analyses reveal the scale of the climate crisis: both the past five years and the past decade are the hottest in 150 years.
The succession of records being broken year after year is “the drumbeat of the Anthropocene”, said one scientist, and is bringing increasingly severe storms, floods, droughts and wildfires.
Read the full article here.
TASK
In small groups, create a presentation that shows the increasing dangers, severity and frequency of the climate emergencies impacts upon the environment and society using a specific type of danger.
Areas of study could include storms, floods, droughts and wildfires, amongst many others.
In your presentation you should include:
- Map locations
- Causes
- Consequences
- Data
- Sourced analysis and evaluations
- Impacts
- Future possibilities
What are the natural factors affecting climate?
Climate is affected by factors outside the earth and within the earth:
- Factors outside the earth:
- Solar radiation emitted from the sun.
- Tilting and orbit of the earth.
- Factors within the earth:
- Atmospheric and ocean circulation systems.
- Greenhouse gases that trap heat and warm the land, oceans and atmosphere.
- Volcanic activity.
- Feedback cycles.
Factors outside the earth
Solar radiation from the sun drives the earth’s climate. The amount of energy reaching the earth’s surface can vary according to the amount of energy emitted from the sun and the position of the earth in relation to the sun.
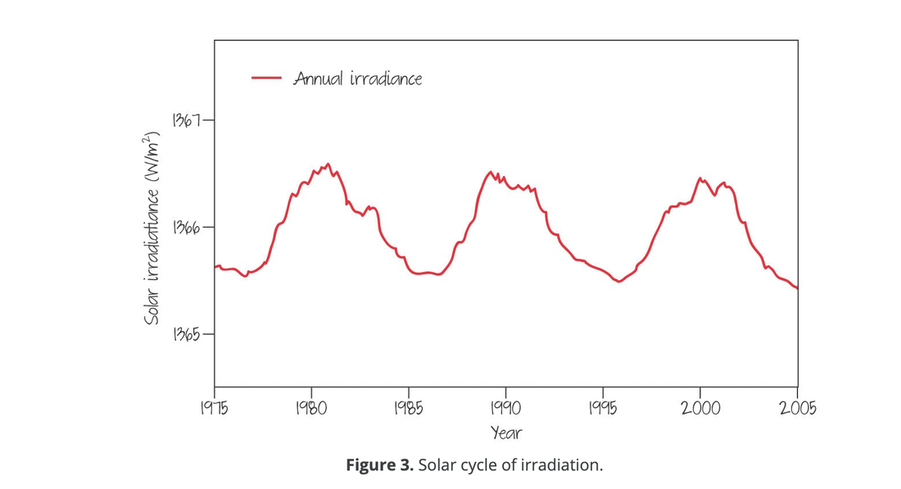
Solar radiation from the sun
The amount of solar energy emitted from the sun has changed in the past. For example, reduction in radiation as a result of low sunspot activity contributed to the "Little Ice Age" from around 1650 to 1850. The sun experiences an 11-year cycle with periods of low and high emissions. However this variation has a minimum impact on the earth’s climate and there have not been any significant changes in solar emissions in recent times.
Solar radiation from the sun drives the earth’s climate. The amount of energy reaching the earth’s surface can vary according to the amount of energy emitted from the sun and the position of the earth in relation to the sun.
Solar radiation from the sun
The amount of solar energy emitted from the sun has changed in the past. For example, reduction in radiation as a result of low sunspot activity contributed to the "Little Ice Age" from around 1650 to 1850. The sun experiences an 11-year cycle with periods of low and high emissions. However this variation has a minimum impact on the earth’s climate and there have not been any significant changes in solar emissions in recent times.
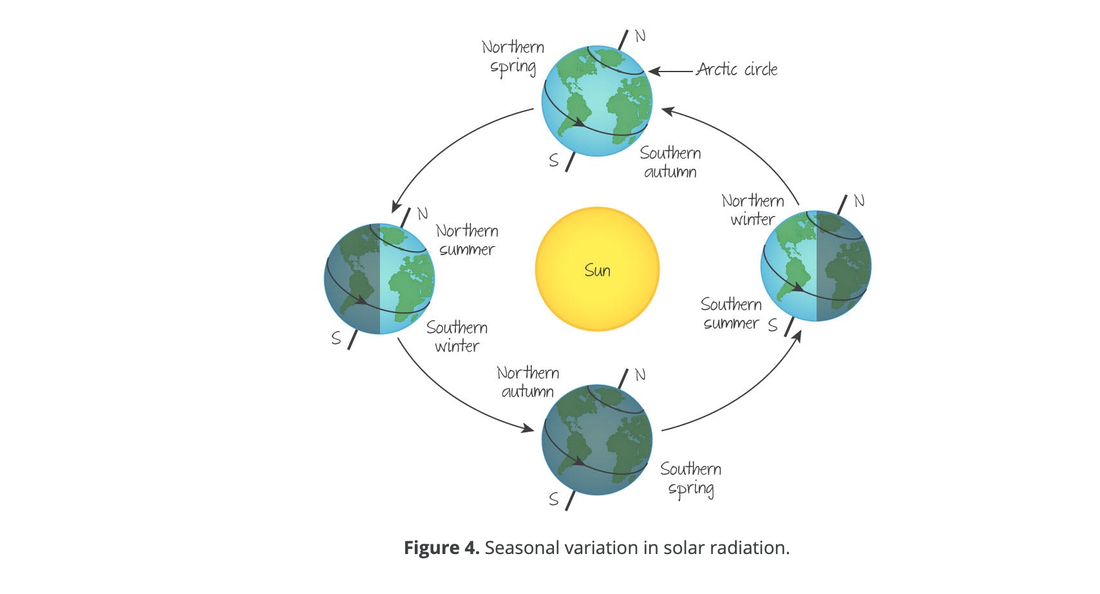
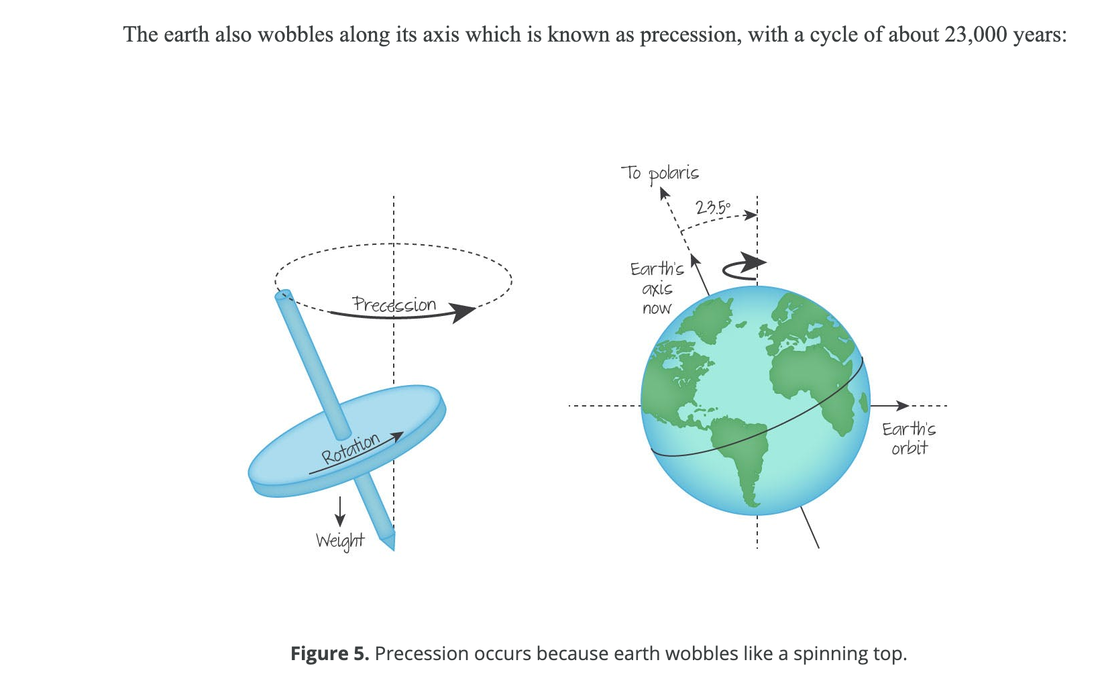
Tilting and orbit of the earth
The axis of the earth is currently tilted at an angle of 23.5°. This axial tilt can vary from 21.6° to 24.5° over a period of 41,000 years. The tilting of the earth influences how much solar energy is absorbed and results in seasonal changes.
When the northern hemisphere tilts (23.5°N) towards the sun:
Conversely, when southern hemisphere it tilted towards the sun:
The axis of the earth is currently tilted at an angle of 23.5°. This axial tilt can vary from 21.6° to 24.5° over a period of 41,000 years. The tilting of the earth influences how much solar energy is absorbed and results in seasonal changes.
When the northern hemisphere tilts (23.5°N) towards the sun:
- It absorbs more sunlight resulting in summer.
- The southern hemisphere is tilted away from the sun leading to winter there, with little light reaching the South Pole.
Conversely, when southern hemisphere it tilted towards the sun:
- It absorbs more sunlight resulting in summer.
- It is winter in the northern hemisphere and it remains dark in the North Pole until the spring.
The orbit of the earth around the sun is not circular, but is elliptical. This is known as the earth’s eccentricity. The variation in the earth's eccentricity has a cycle of about 100,000 years. The elliptical orbit means that the distance of the earth from the sun varies through the year, with the closest point currently occurring in January. Nevertheless, there is little change in the amount of energy reaching the earth.
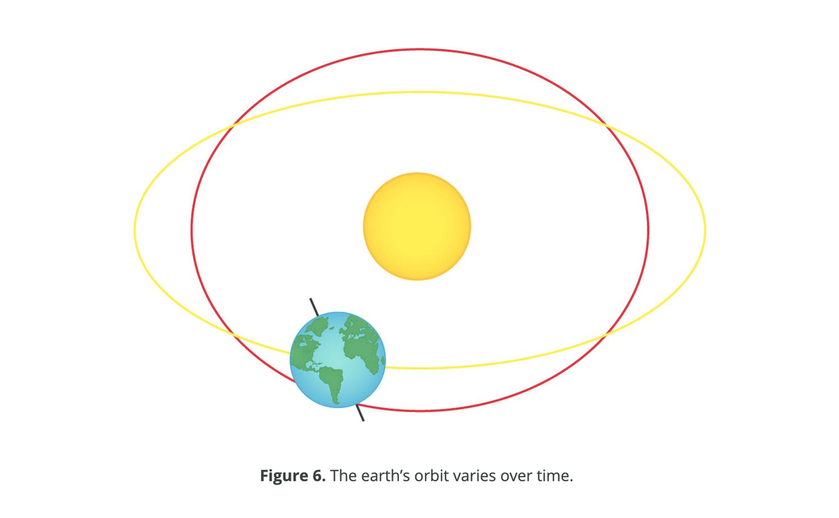
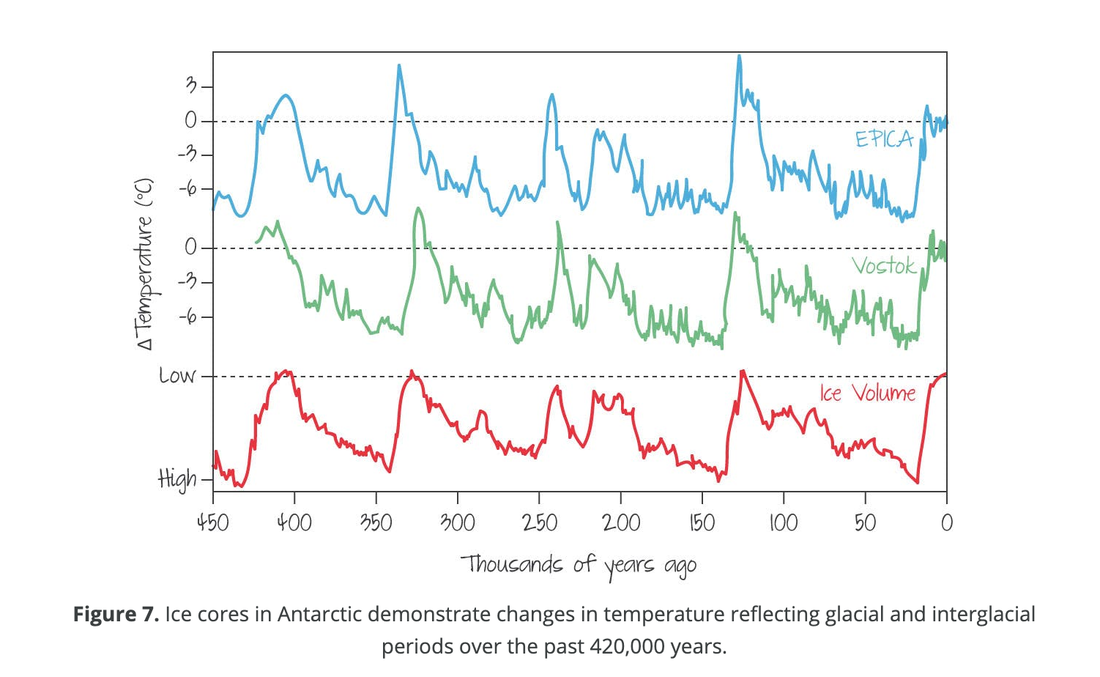
Collectively, the cycles of axial tilt, precession and eccentricity are referred to as the Milankovitch cycle and influence the amount of sunlight reaching the earth. The Milankovitch cycle contributes to the earth’s fluctuation between glacial periods (ice age) and interglacial periods.
TASK
Use the link to Skeptical Science below to compare how the natural climate affects that you have just read about relate to the changes that we are seeing over the past 100 years.
Have a good look around the sight and take plenty of notes on the arguments and evidence being presented.
Make sure to clearly organise your work with headings and titles.
TASK - Formative
Produce a comparative table using Word.doc that shows the arguments, data and perspectives of both sides of the climate debate on a range of issues.
You must include data, graphs and diagrams wherever possible. Give your own analysis and evaluation of the strength of each argument for each of the issues. Use the core ideas found in OPVL to form a critical opinion of sources.
Climate's changed before
It's the sun
It's not bad
There is no consensus
It's cooling
Models are unreliable
Temp record is unreliable
Animals and plants can adapt
It hasn't warmed since 1998
Antarctica is gaining ice
This information will form the basis of the summative assessment. This will involve analysis of data, graphs, opinions and arguments.
What does the school community think about the Climate Emergency?
TASK
Use Survey Monkey to design and conduct a survey of the school communities attitude to the Climate Emergency and other connected climate and environmental issues.
We will then use this information to produce a report upon the findings which will include graphical and analytical information from which valid evaluations and conclusions can be reached.
This will be a final formative and summative assessment for this unit of work.
Questions and collecting responses will be done as small groups and will get formative feedback.
Final reports must be done and submitted individually.
It is important that you think about the questions you want to ask in terms of what it is you want to know from the survey. For example, do you want to know to what extent people agree with Climate Change science? Do you want to see how much people know about Climate Change? Do you want to know what they do practically to help with the climate crisis? And many more possibilities. Think carefully.
Organise your questions into types.
Attitudes to the idea of a Climate Emergency
Knowledge of Climate Change and the Emergency
Lifestyle and actions to offset Climate Emergency
10 to 15 questions should be plenty.
Attitudes to the idea of a Climate Emergency
Knowledge of Climate Change and the Emergency
Lifestyle and actions to offset Climate Emergency
10 to 15 questions should be plenty.
Organising your responses by age group and gender will create another layer of analysis.
Presenting the data collected can be done in a number of ways.
Tools such as surveymonkey can often create a range graphs automatically.
- Bar Graph: Used when comparing various items or ideas.
- Histogram: Used to show frequency and compare items or ideas; each bar represents an interval of values.
- Line Graph: Used to show change over time.
- Pictograph: Used to show frequency and compare items or ideas.
- Circle Graph (or Pie Graph): Used to show parts or percentages of a whole.
- Box-and-Whisker Plot: Used to show the range of values as well as the median, quartiles, and outliers; five-number summary is another name for this representation.
- Line Plot: Used to easily organise one group of data.
- Scatterplot (or Scattergram): Used to determine if a correlation exists between two data sets, and how strong it is, also used to calculate line or curve of best fit.
- Stem-and-Leaf Plot: Used to show frequency; data is grouped according to place value, using the digit in the greatest place.
Tools such as surveymonkey can often create a range graphs automatically.
Finally, your final short report (400 - 500 words) needs to evaluate what we have found from the data; for example do more females than males consider the Climate Emergency a greater problem? Do younger responders do more to change their lifestyle?
A short conclusion that summarises the main patterns and trends can then be made.
A short conclusion that summarises the main patterns and trends can then be made.
This can be done effectively using Word - Research paper template.
|
Mark scheme
5 marks for quality of questions and data collected 1 - Limited quality of questions that give limited data. Data and graphs poorly presented. 3 - Satisfactory evidence of effective questions. Survey results are limited in scope. Data and graphs somewhat effective. 5 - Evidence of effective questions and survey results. Survey results give chance for detailed use of data. Data and graphs well-presented and effective. |
5 marks for evaluation of results 1 - Little evidence of structure, organisation or evaluation. 3 - Satisfactory use of structure and evaluation to offer valid if poorly supported conclusions. 5 - Well-presented report with clear and effective use of data to support valid evaluations and conclusions. Clear and effective narrative flow. |
