How has energy transformed the human experience?
How are fossil fuels formed?
TASK
1. Watch the video and create a graphic that explains the formation of:
2. What are the benefits of using fossil fuels?
3. What are the negative impacts of using fossil fuels?
1. Watch the video and create a graphic that explains the formation of:
- Coal
- Oil
- Natural gas
2. What are the benefits of using fossil fuels?
3. What are the negative impacts of using fossil fuels?
How is electricity generated?
Non-renewable energy
Global energy use is still dominated by non-renewable energy. These produce greenhouse gasses, use damaging extractive methods such as drilling, mining and fracking, and have detrimental effects upon peoples health and the environment.
Global energy use is still dominated by non-renewable energy. These produce greenhouse gasses, use damaging extractive methods such as drilling, mining and fracking, and have detrimental effects upon peoples health and the environment.
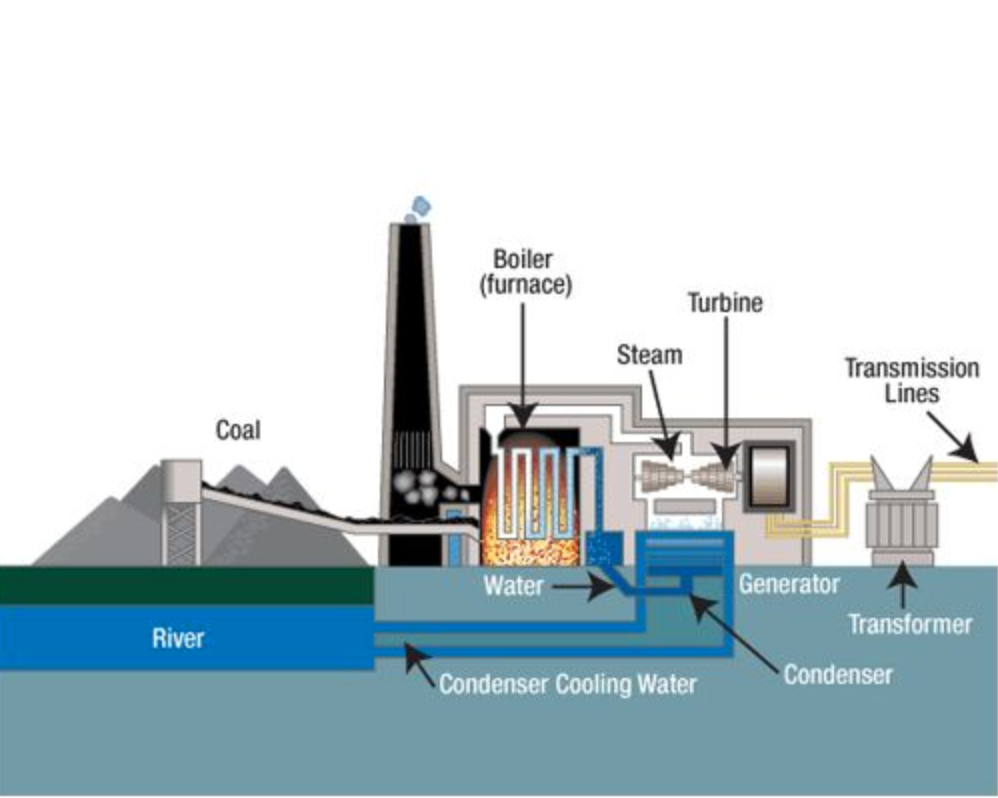
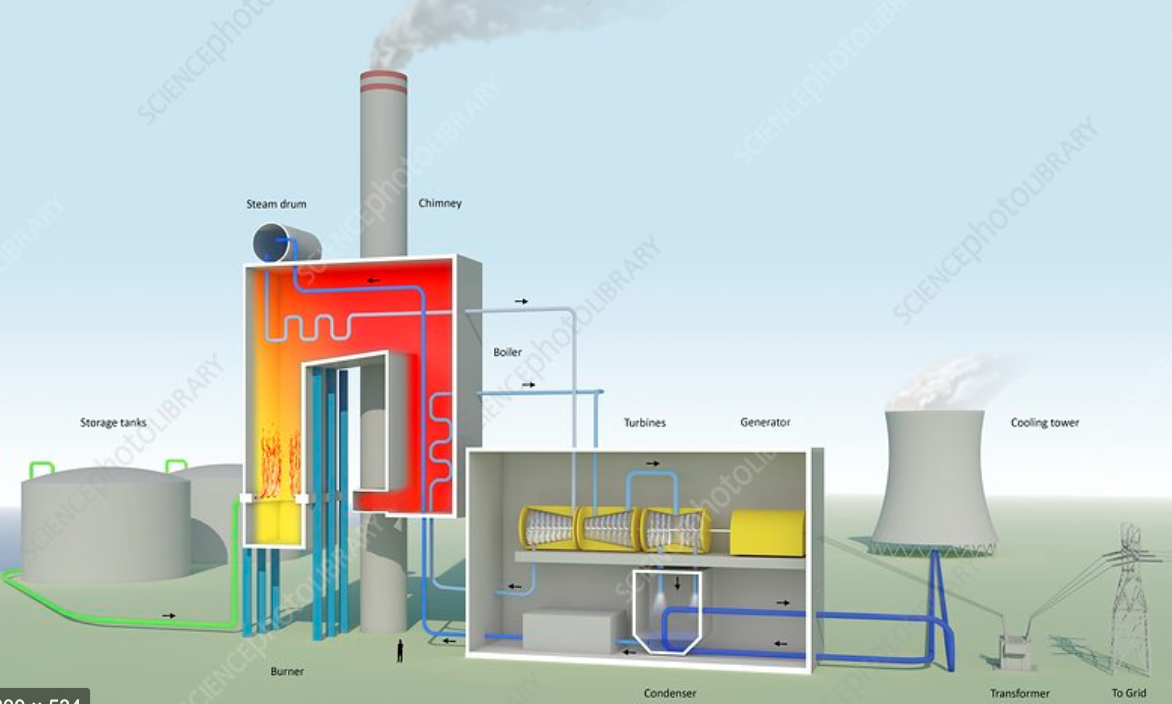
Coal
|
Oil
|
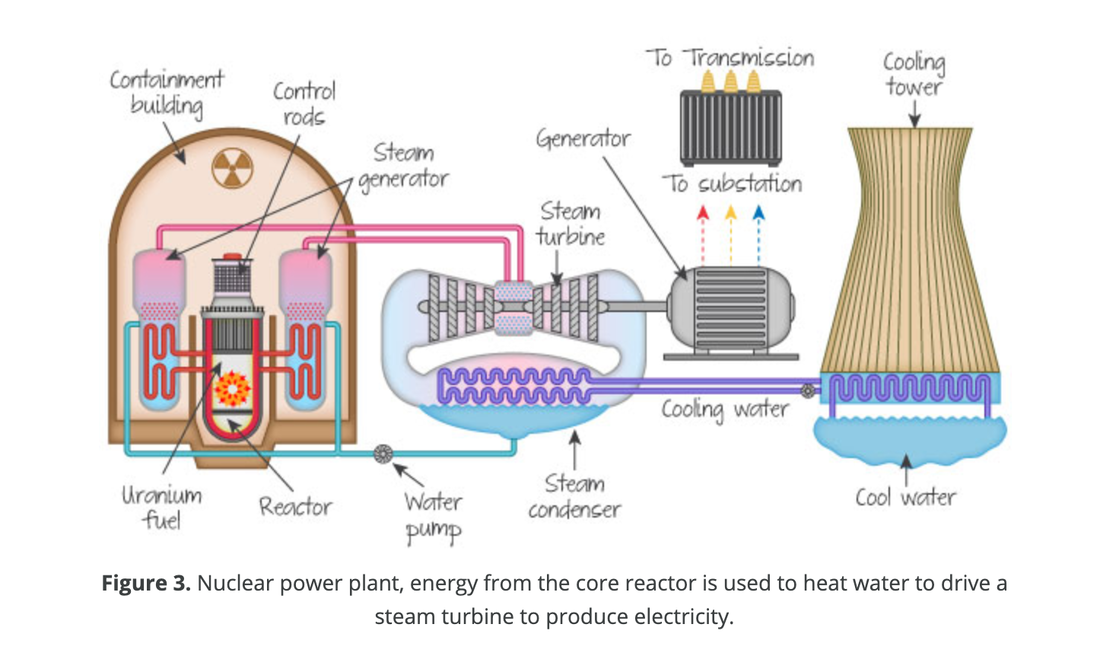
Nuclear
However, the use of non-renewable can be made more efficient. This could increase energy supplies and potentially reduce emissions, as less fuel would be used.
- Fossil fuels - coal and gas power stations can now re-use wasted heat in. These are called combined-cycle systems. Re-using heat makes the most out of the fossil fuel. Also, some power stations now burn small amounts of biomass alongside fossil fuels. This is called co-firing and it makes the fossil fuel last longer. Fracking could exploit shale gas, which would increase supplies of fossil fuels.
- Nuclear power - uranium fuel rods still have some uranium left within them after they have been used. Reprocessing recovers the uranium from spent fuel rods so that it can be reused. This doesn't create new supplies of uranium, but it does use the existing supplies more efficiently. This means that uranium supplies will last longer.
5. Why might efficiency savings not be as big as hoped, or even not happen at all?
Renewable energy
Renewable technologies offer a way to increase energy supplies, however they are often more expensive or less efficient at producing energy than fossil fuels. Therefore they often require government subsidies.
Renewable technologies offer a way to increase energy supplies, however they are often more expensive or less efficient at producing energy than fossil fuels. Therefore they often require government subsidies.
- Biomass - this is recently-formed material derived from living things, eg chicken droppings. 'Energy from waste' plants burn biomass and non-recyclable rubbish to generate electricity.
- Hydroelectric power (HEP) - HEP is generated when river water is trapped behind a dam and used to turn turbines. The UK generates 1.5% of its electricity this way. Most suitable locations for dam building have already been used.
- Wave power and tidal power - the UK is an island nation, yet it generates very little energy using the sea. Wave energy harnesses the power of small movements on the surface of the sea. The technology is new and currently expensive. Tidal energy harnesses larger movements of the tides. There are plans for tidal lagoons to be built in the UK.
- Geothermal power - this uses heat within the Earth to generate electricity. This is easier where geothermal heat is more accessible, eg Iceland. There are few suitable locations so geothermal energy is rare in many countries. Ground source heat pumps are a similar idea, but they use the heat from the Sun that is stored within the surface of the Earth.
- Solar power - the UK government wants to increase the use of solar power by 2020. Solar panels can be fitted onto buildings or within fields. They turn sunlight into electricity. New technology is making solar panels able to generate electricity on cloudy days, which would be good for the UK.
- Wind power - wind turbines convert air movements into electricity. In the UK wind speeds are consistent and so this is a good way to generate electricity. The UK generates more wind energy using turbines on the land (onshore). As an island nation, the UK could build more turbines in the sea (offshore) though these are more expensive than onshore turbines.
|
|
|
|
|
|
TASK
6. Describe how each of these energy resources is used to generate electricity.
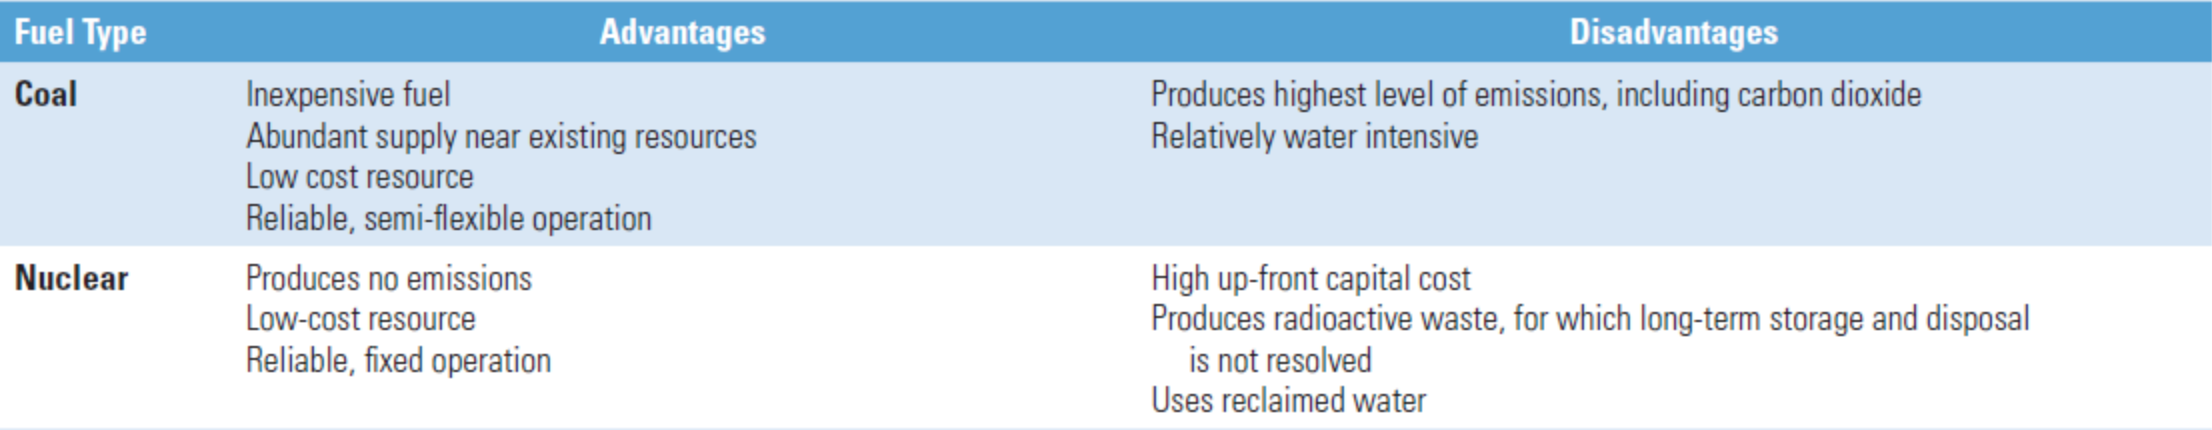
7. Describe the environmental, economic and social advantages and disadvantages of each of these energy resources.
Use a table like this to organise your work. Use colour coding to describe the different impacts.
6. Describe how each of these energy resources is used to generate electricity.
7. Describe the environmental, economic and social advantages and disadvantages of each of these energy resources.
Use a table like this to organise your work. Use colour coding to describe the different impacts.
TASK
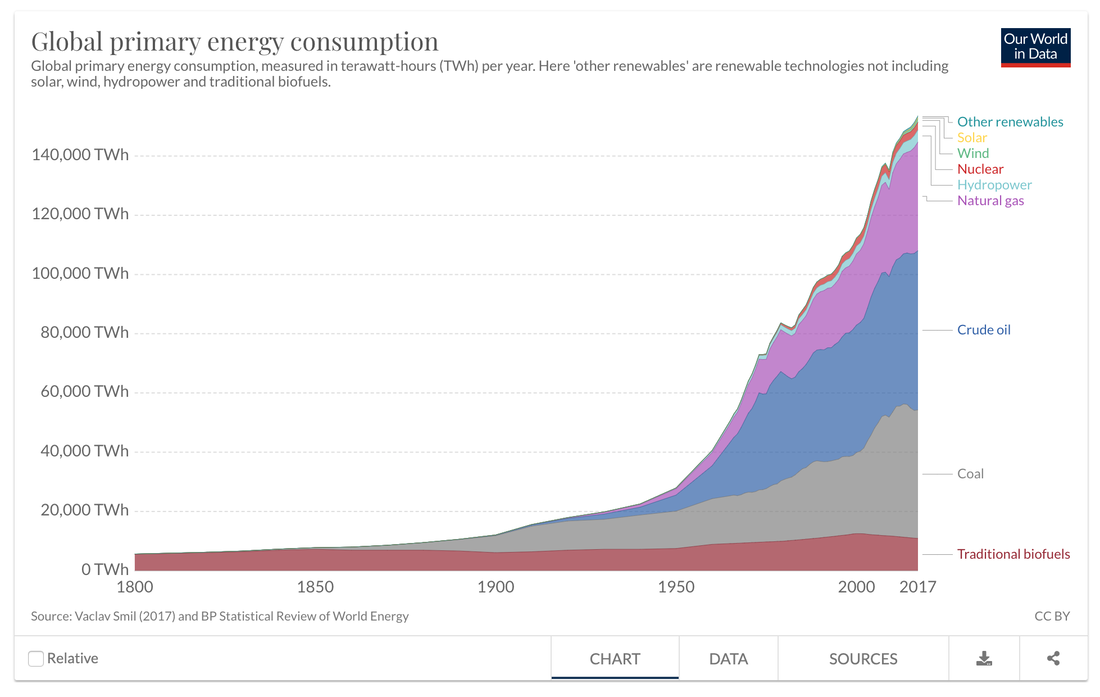
8. Describe the trends in global energy consumption shown in the graph shown in the graph. Use data in your answer.
9. Explain why consumption has increased so significantly from around 1950.
10. Estimate the percentage use of non-renewables compared to renewables.
11. Suggest why coal use has begun to decrease in recent years.
12. Using the graphical trends, estimate a valid scenario for our energy future in the 21st Century.
|
|
|
TASK
13. In groups of 3 or 4, create a range of questions for the information and trends shown in the graph on renewable energy investment.
Questions should be ones that require further investigation such as, "Which renewable technologies receive the most investment?", or "Why has investment in renewables in Europe more than halved since 2011?"
We will then share questions between the groups in class and attempt to come up with answers.
TASK
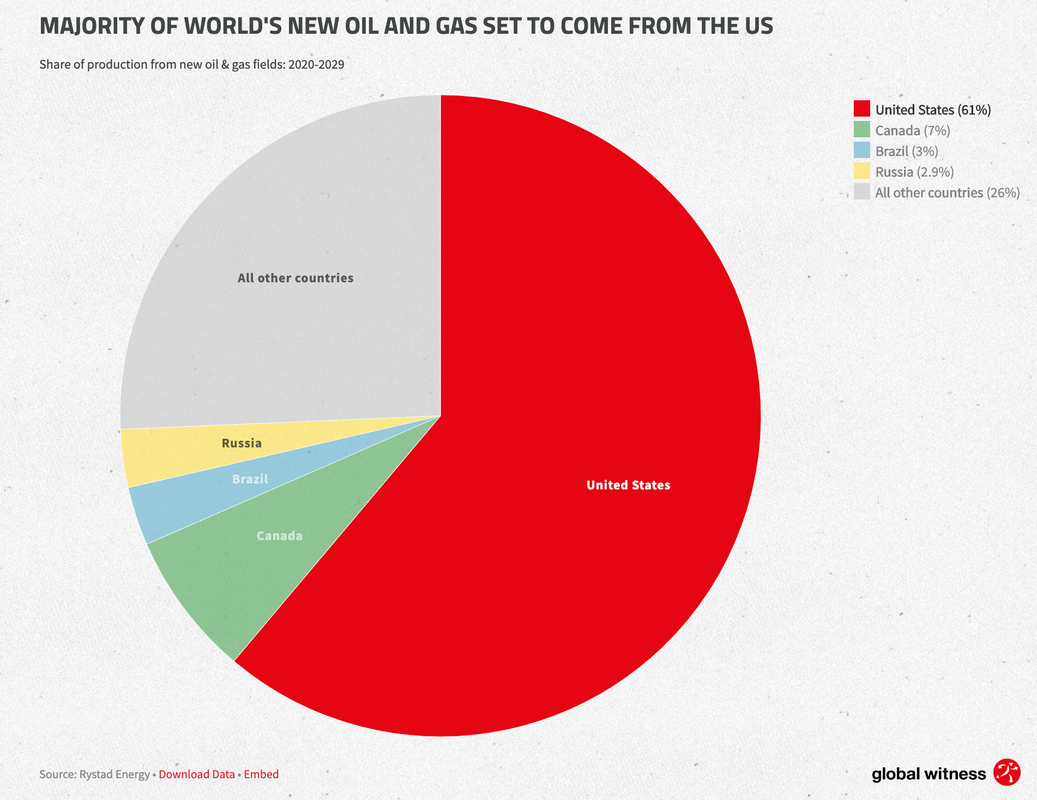
14. Identify the reasons for the huge increase in US oil production compared to the broader global trends. Have at least one political, one economic, one environmental and one social reason in your answer.
15. Watch the videos below and make notes on the issues raised.
Describe and explain the trends shown in each video.
|
|
|
Can we continue to enjoy bountiful energy?
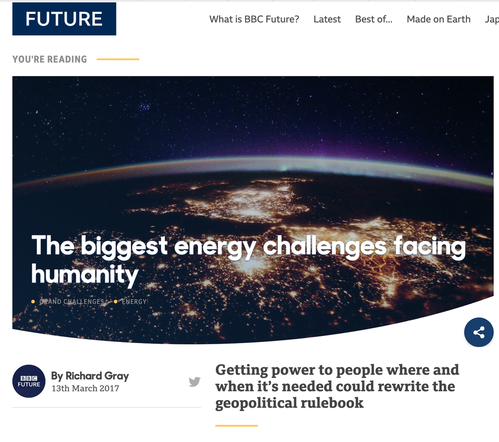
Click on the image to read the BBC article
|
Every day, our species chews its way through more than a million terajoules of energy. That’s roughly equivalent to what we would use if all 7.5 billion of us boiled 70 kettles of water an hour around the clock. Or 3,000 times the daily output of Palo Verde nuclear power station in Arizona – one of the world’s largest – running at full capacity. With the global population swelling and industrialisation on the rise in developing nations, humanity’s hunger for energy has reached unprecedented levels. More than half of our energy comes from fossil fuels extracted from deep within the Earth’s crust. It is estimated that since commercial oil drilling began in the 1850s, we have sucked up more than 135 billion tonnes of crude oil to drive our cars, fuel our power stations and heat our homes. That figure increases every day. |
TASK
16. Read the article above and summarise the arguments made in terms of political, economic, environmental and social issues and impacts.
17. Create a class presentation that argues for or against the arguments made by the author. Use your own specific research to support and justify your argument.
16. Read the article above and summarise the arguments made in terms of political, economic, environmental and social issues and impacts.
17. Create a class presentation that argues for or against the arguments made by the author. Use your own specific research to support and justify your argument.
How damaging can oil pollution be?
The risk of oil pollution is present at all stages of oil company operations.
- Drilling can create oil well leaks and oil seeping through the ground and onto the surface, not to mention war and destruction of oil facilities.
- Transporting oil can suffer pipeline leaks, pipeline sabotage and oil tanker accidents.
- Oil refining can suffer leaks and explosions.
The effects of oil spills on humans may be direct and indirect, depending on the type of contact with the oil spill.
Direct exposure to oil spills – occurs close to where people live or work and where they may come in contact with oil spill components:
Indirect exposure to oil spills - even when people live in places far from where the actual oil spill took place:
Direct exposure to oil spills – occurs close to where people live or work and where they may come in contact with oil spill components:
- By breathing contaminated air - since oil and products (petroleum products) have many volatile compounds which are emitted as gases from spilled oil, the air becomes contaminated with those volatile oil products or vapours producing specific odours.
- By direct contact with the skin - people may come in direct contact with oil and/or oil products while walking in a contaminated area (e.g., beach). An initial irritation will be obvious. Additionally, contaminants may be absorbed through the skin and enter the body.
Indirect exposure to oil spills - even when people live in places far from where the actual oil spill took place:
- By bathing in contaminated water - for example swimming in a contaminated water stream - even when an oil sheen may not be visible, dissolved oil contaminants may exist in the water if it was impacted by an oil spill
- By eating contaminated food - some oil compounds bioaccumulate in living organisms and may become more concentrated along the food chain. Humans may become exposed to concentrations of contaminants in the food that could be orders of magnitude higher than in the contaminated environment.
Just 1 litre of oil can contaminate 1 million litres of water.
Oil pollution can have a devastating effect on the water environment, it spreads over the surface in a thin layer that stops oxygen getting to the plants and animals that live in the water. Oil pollution:
Wildfowl are particularly vulnerable, both through damage to the waterproofing of their plumage and through eating the oil as they preen. Mammals such as water voles may also be affected too.
In the ground and soil, oils coat or kill the organisms which are necessary to maintain the environmental balance.
Oil pollution can have a devastating effect on the water environment, it spreads over the surface in a thin layer that stops oxygen getting to the plants and animals that live in the water. Oil pollution:
- harms animals and insects
- prevents photosynthesis in plants
- disrupts the food chain
- takes a long time to recover
Wildfowl are particularly vulnerable, both through damage to the waterproofing of their plumage and through eating the oil as they preen. Mammals such as water voles may also be affected too.
In the ground and soil, oils coat or kill the organisms which are necessary to maintain the environmental balance.
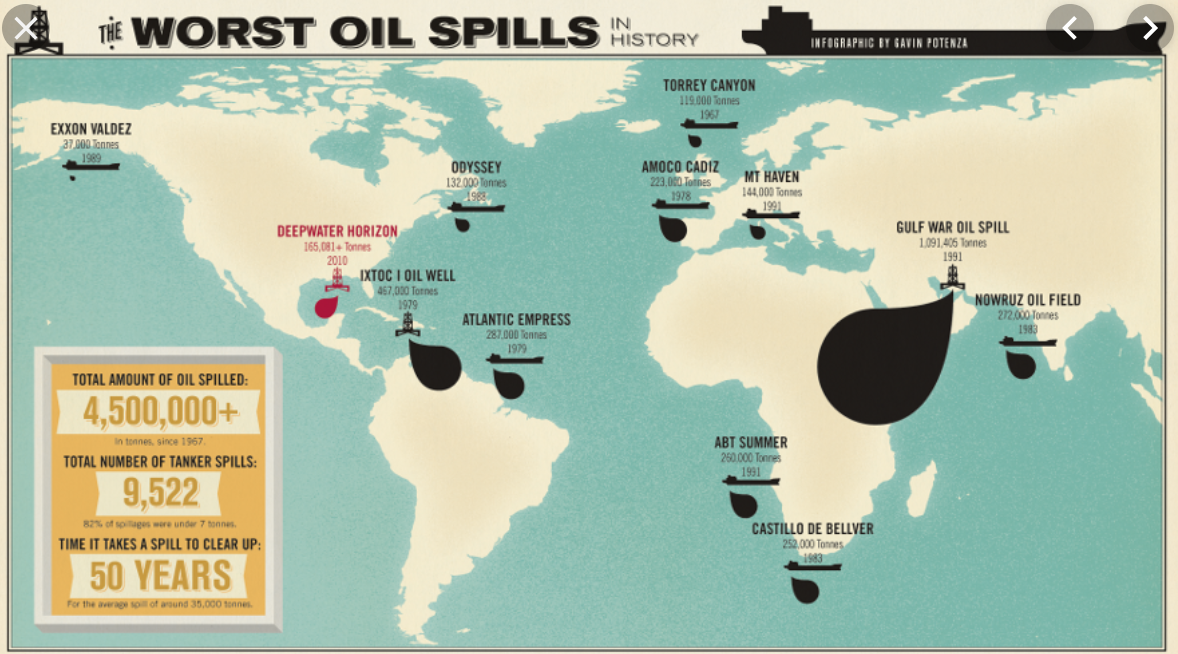
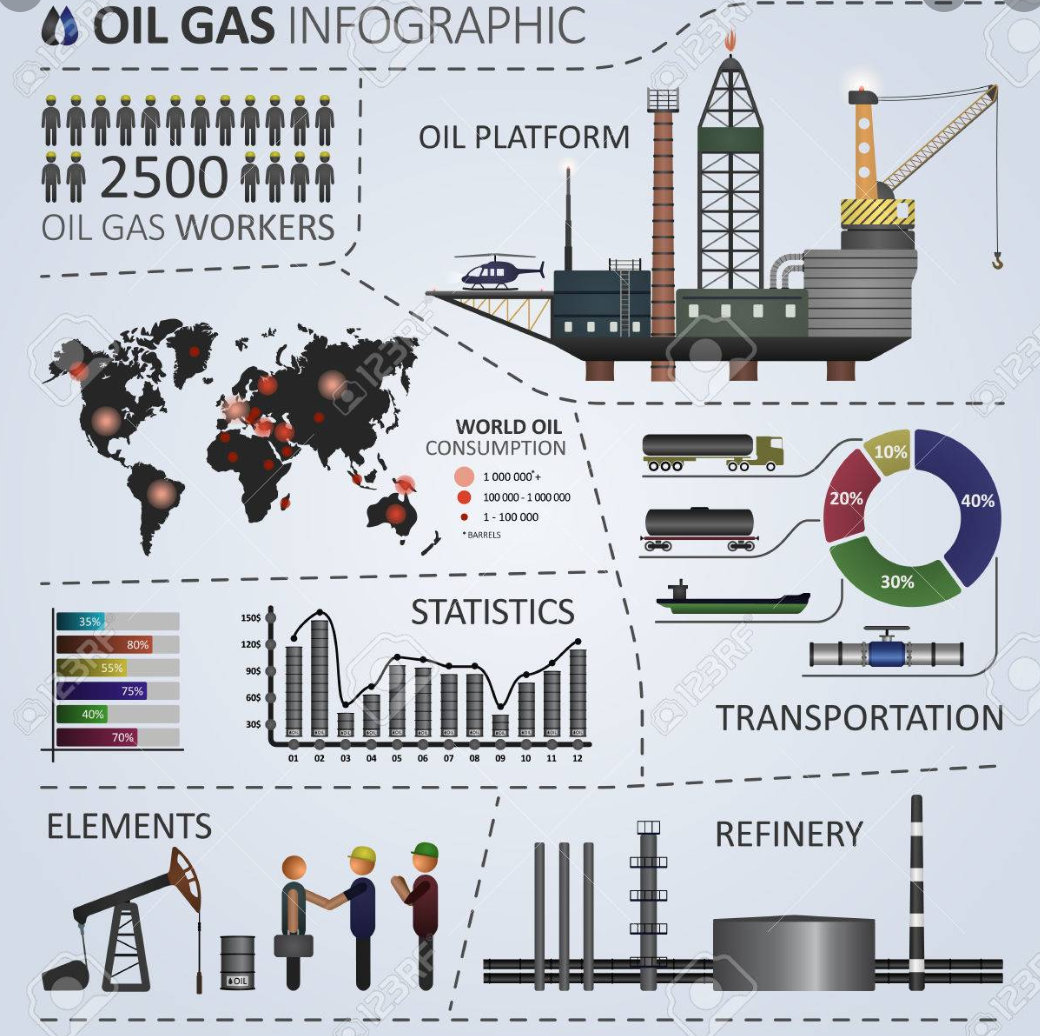
TASK - Research
Choose one of the oil spill events (not Deepwater Horizon) from the infographic and do some further research on the event. Think in terms of PEES as you gather the information.
Include:
Choose one of the oil spill events (not Deepwater Horizon) from the infographic and do some further research on the event. Think in terms of PEES as you gather the information.
Include:
- Causes
- Consequences (long and short-term)
- Management and environmental changes made (laws, global agreements)
What are the environmental problems from the use of oil?
Deepwater Horizon and problems in the Gulf of Mexico
On April 20, 2010, the BP oil company’s Macondo well blew out in mile-deep water in the Gulf of Mexico, causing the Deepwater Horizon drill rig to explode, killing 11 workers, injuring 17 others, and initiating one of the worst environmental disasters in American history. Over the course of 87 days, the nation watched in horror as numerous attempts to cap the gushing Macondo well failed. When the flow finally stopped on July 15, 2010, an estimated 171 million gallons of oil had leaked into the highly productive and biodiverse Gulf of Mexico. Furthermore, 1.8 million gallons of toxic chemical dispersants were used in response efforts.
|
|
|
|
|
|
|
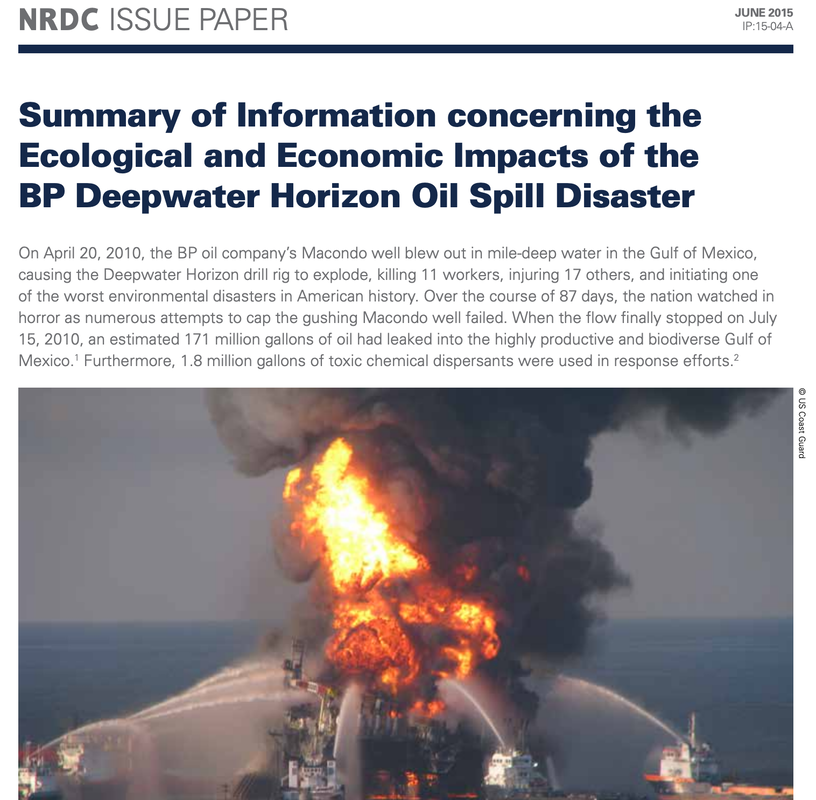
Click on the image to access the full report.
TASK - Summative
Create an infographic that tells the story of the Deepwater Horizon disaster.
Include:
Create an infographic that tells the story of the Deepwater Horizon disaster.
Include:
- Causes and consequences (short and long-term)
- Environmental impacts
- Future possibilities for oil exploration and extraction
- data
- graphics
- well-selected but limited text
- clear narrative flow
- specific located examples and issues.
|
Mark scheme 5 marks for quality of content and data 1 - Little data, explanation of issues limited and no evidence of further research. 3 - Satisfactory use of data to explain issues. Impacts mostly clear and evidence of research. 5 - Detailed data with analysis of issues. Impacts valid and clear. Evidence of effective research. |
5 marks for layout and visual effectiveness 1 - Little evidence of structure or organisation 3 - Satisfactory use of structure and visual techniques. Some evidence of originality. 5 - Well-presented infographic with clear and effective use of data and graphical techniques. Clear and effective narrative flow. Original and creative graphical techniques. |
Follow the guidance and instructions below to create your infographic.
|

|

Click to sign up and download Powerpoint infographic templates
|

Click on the image for free templates

Click on the image for free templates
|
